

Applications of the pipeline environment for visual informatics and genomics computations
- PMID: 21791102
- PMCID: PMC3199760
- DOI: 10.1186/1471-2105-12-304
Applications of the pipeline environment for visual informatics and genomics computations
Abstract
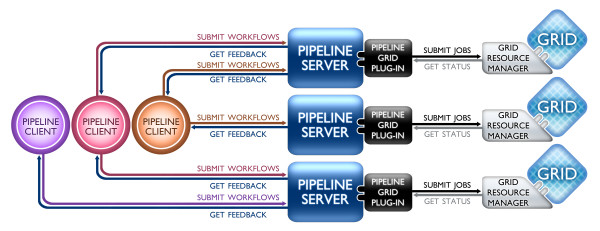
Background: Contemporary informatics and genomics research require efficient, flexible and robust management of large heterogeneous data, advanced computational tools, powerful visualization, reliable hardware infrastructure, interoperability of computational resources, and detailed data and analysis-protocol provenance. The Pipeline is a client-server distributed computational environment that facilitates the visual graphical construction, execution, monitoring, validation and dissemination of advanced data analysis protocols.
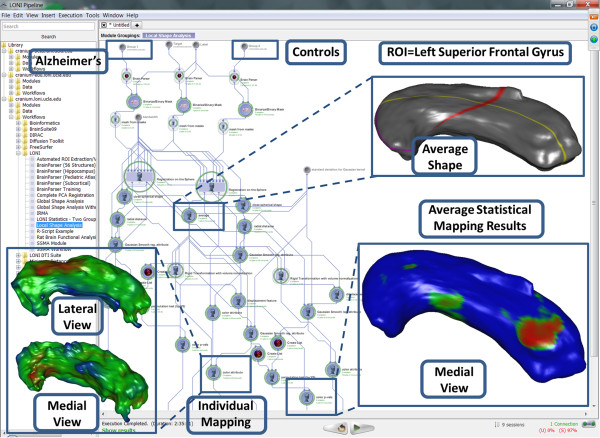
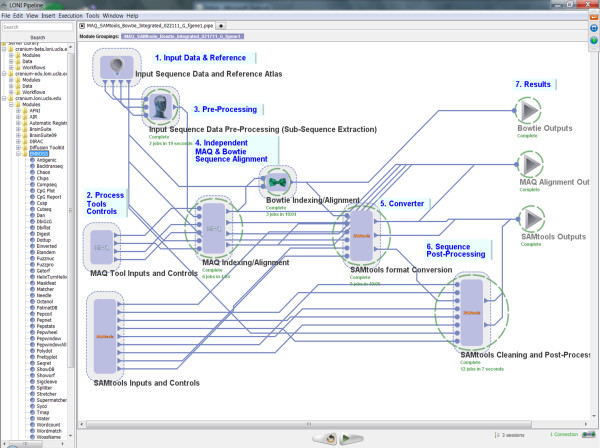
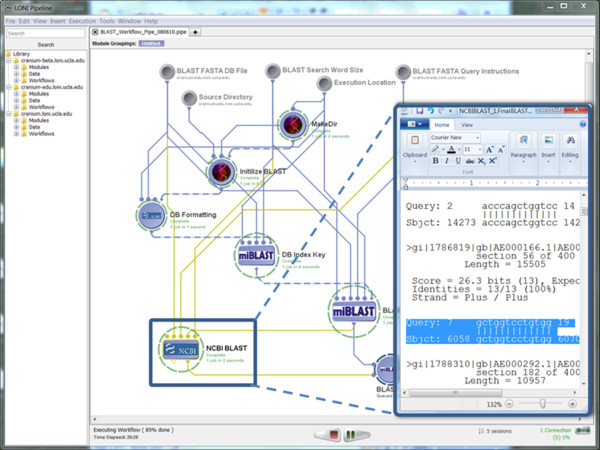
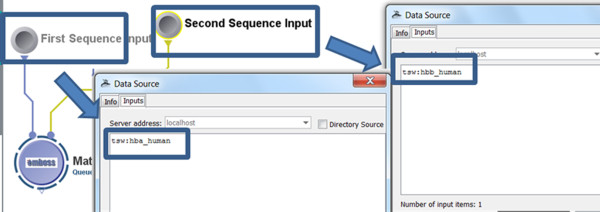
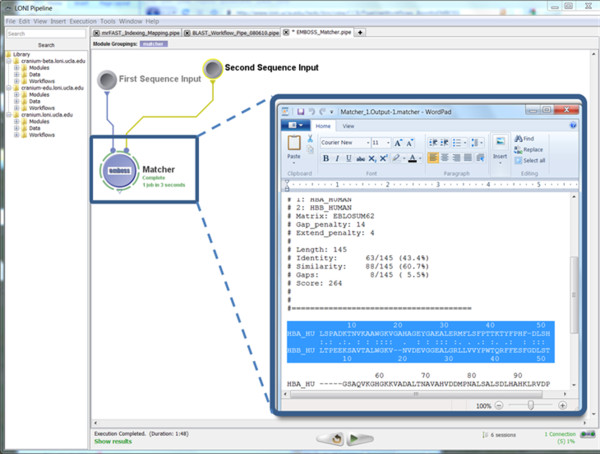
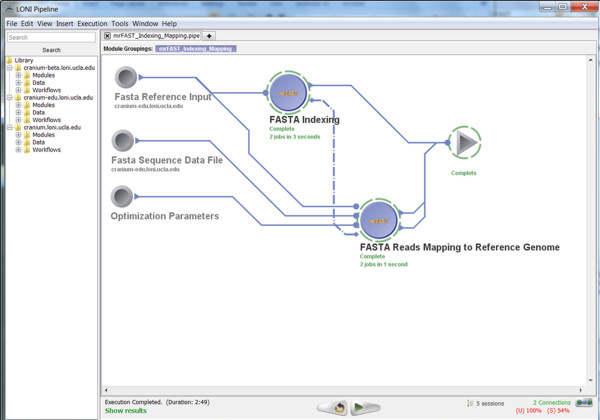
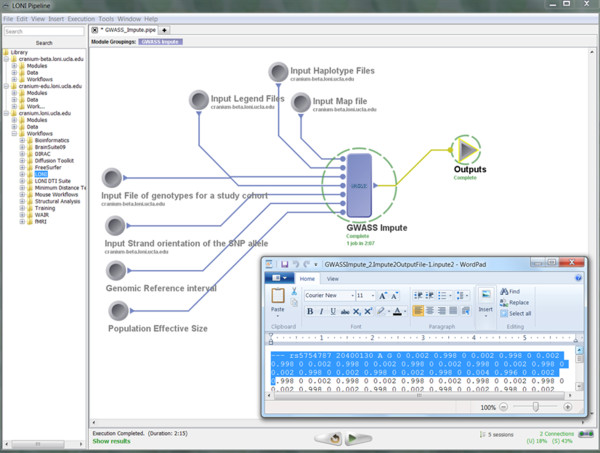
Results: This paper reports on the applications of the LONI Pipeline environment to address two informatics challenges - graphical management of diverse genomics tools, and the interoperability of informatics software. Specifically, this manuscript presents the concrete details of deploying general informatics suites and individual software tools to new hardware infrastructures, the design, validation and execution of new visual analysis protocols via the Pipeline graphical interface, and integration of diverse informatics tools via the Pipeline eXtensible Markup Language syntax. We demonstrate each of these processes using several established informatics packages (e.g., miBLAST, EMBOSS, mrFAST, GWASS, MAQ, SAMtools, Bowtie) for basic local sequence alignment and search, molecular biology data analysis, and genome-wide association studies. These examples demonstrate the power of the Pipeline graphical workflow environment to enable integration of bioinformatics resources which provide a well-defined syntax for dynamic specification of the input/output parameters and the run-time execution controls.
Conclusions: The LONI Pipeline environment http://pipeline.loni.ucla.edu provides a flexible graphical infrastructure for efficient biomedical computing and distributed informatics research. The interactive Pipeline resource manager enables the utilization and interoperability of diverse types of informatics resources. The Pipeline client-server model provides computational power to a broad spectrum of informatics investigators--experienced developers and novice users, user with or without access to advanced computational-resources (e.g., Grid, data), as well as basic and translational scientists. The open development, validation and dissemination of computational networks (pipeline workflows) facilitates the sharing of knowledge, tools, protocols and best practices, and enables the unbiased validation and replication of scientific findings by the entire community.
Figures


Similar articles
-
Efficient, Distributed and Interactive Neuroimaging Data Analysis Using the LONI Pipeline.Front Neuroinform. 2009 Jul 20;3:22. doi: 10.3389/neuro.11.022.2009. eCollection 2009. Front Neuroinform. 2009. PMID: 19649168 Free PMC article.
-
Neuroimaging study designs, computational analyses and data provenance using the LONI pipeline.PLoS One. 2010 Sep 28;5(9):e13070. doi: 10.1371/journal.pone.0013070. PLoS One. 2010. PMID: 20927408 Free PMC article.
-
High-throughput neuroimaging-genetics computational infrastructure.Front Neuroinform. 2014 Apr 23;8:41. doi: 10.3389/fninf.2014.00041. eCollection 2014. Front Neuroinform. 2014. PMID: 24795619 Free PMC article.
-
User-centric genomics infrastructure: trends and technologies.Genome. 2021 Apr;64(4):467-475. doi: 10.1139/gen-2020-0096. Epub 2020 Nov 20. Genome. 2021. PMID: 33216660 Review.
-
Guiding the choice of informatics software and tools for lipidomics research applications.Nat Methods. 2023 Feb;20(2):193-204. doi: 10.1038/s41592-022-01710-0. Epub 2022 Dec 21. Nat Methods. 2023. PMID: 36543939 Free PMC article. Review.
Cited by
-
Neurological imaging: statistics behind the pictures.Imaging Med. 2011 Aug 1;3(4):423-432. doi: 10.2217/iim.11.37. Imaging Med. 2011. PMID: 22180753 Free PMC article.
-
Workflows for microarray data processing in the Kepler environment.BMC Bioinformatics. 2012 May 17;13:102. doi: 10.1186/1471-2105-13-102. BMC Bioinformatics. 2012. PMID: 22594911 Free PMC article.
-
Regional neuroplastic brain changes in patients with chronic inflammatory and non-inflammatory visceral pain.PLoS One. 2014 Jan 8;9(1):e84564. doi: 10.1371/journal.pone.0084564. eCollection 2014. PLoS One. 2014. PMID: 24416245 Free PMC article.
-
Armadillo 1.1: an original workflow platform for designing and conducting phylogenetic analysis and simulations.PLoS One. 2012;7(1):e29903. doi: 10.1371/journal.pone.0029903. Epub 2012 Jan 11. PLoS One. 2012. PMID: 22253821 Free PMC article.
-
Structural Brain Changes in Early-Onset Alzheimer's Disease Subjects Using the LONI Pipeline Environment.J Neuroimaging. 2015 Sep-Oct;25(5):728-37. doi: 10.1111/jon.12252. Epub 2015 May 4. J Neuroimaging. 2015. PMID: 25940587 Free PMC article.
References
-
- Samatova NF, Breimyer P, Hendrix W, Schmidt MC, Rhyne TM. An outlook into ultra-scale visualization of large-scale biological data. Ultrascale Visualization, 2008 UltraVis 2008 Workshop on: 16-16 Nov. 2008. 2008. pp. 29–39.
