. 2011 Jul 26:8:27.
doi: 10.1186/1742-4682-8-27.

Site-specific dose-response relationships for cancer induction from the combined Japanese A-bomb and Hodgkin cohorts for doses relevant to radiotherapy

Affiliations

Site-specific dose-response relationships for cancer induction from the combined Japanese A-bomb and Hodgkin cohorts for doses relevant to radiotherapy

Uwe Schneider et al. Theor Biol Med Model. .

Abstract

Background and purpose: Most information on the dose-response of radiation-induced cancer is derived from data on the A-bomb survivors. Since, for radiation protection purposes, the dose span of main interest is between zero and one Gy, the analysis of the A-bomb survivors is usually focused on this range. However, estimates of cancer risk for doses larger than one Gy are becoming more important for radiotherapy patients. Therefore in this work, emphasis is placed on doses relevant for radiotherapy with respect to radiation induced solid cancer.

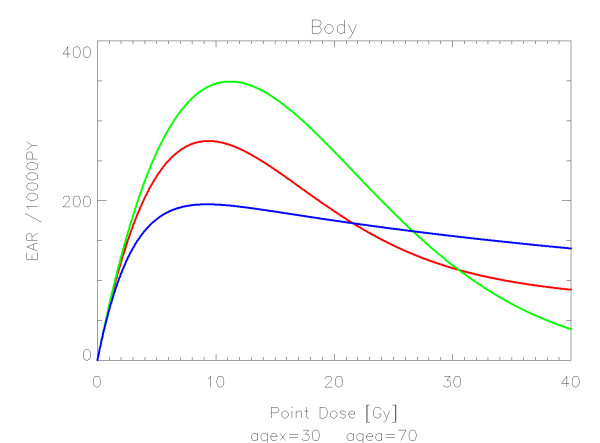
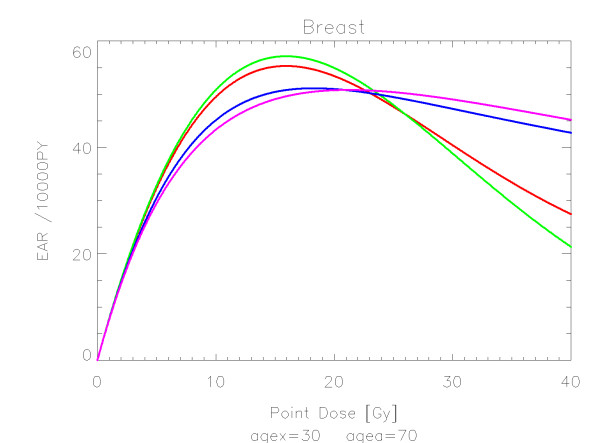
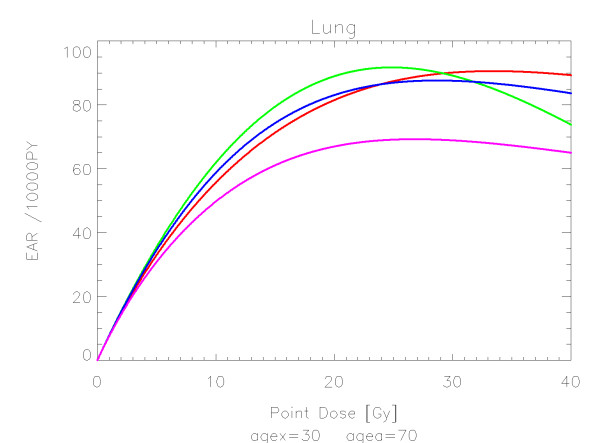
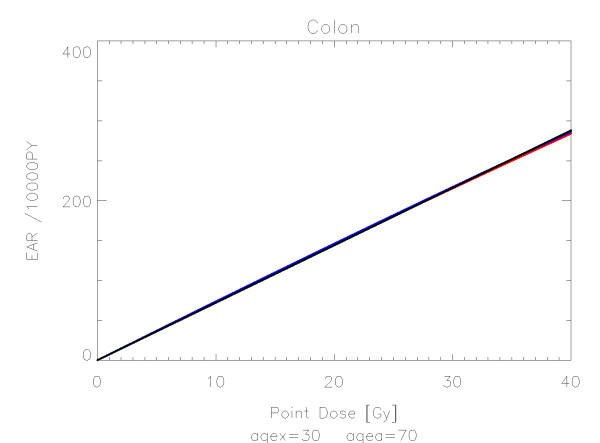
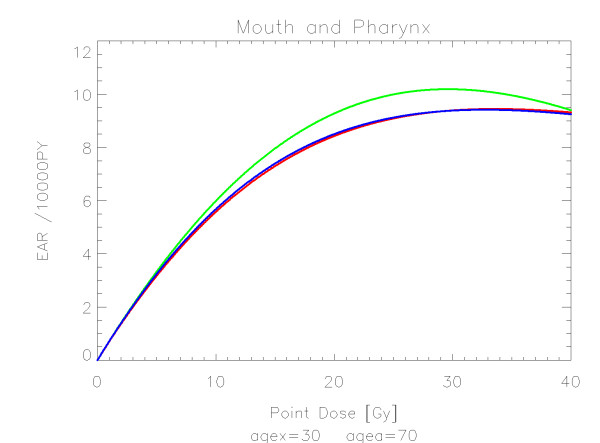
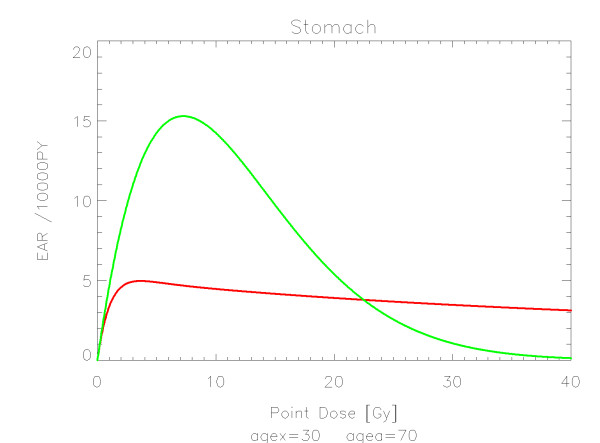
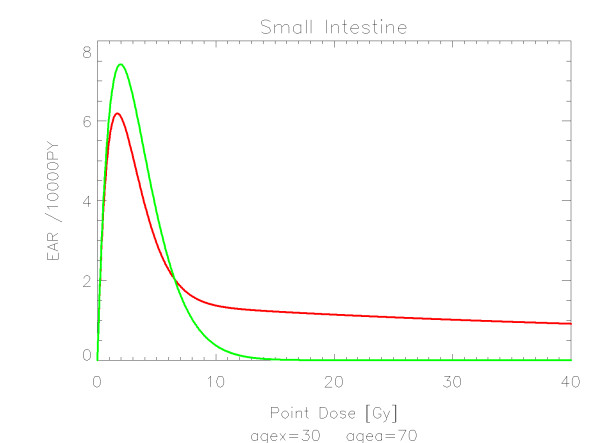
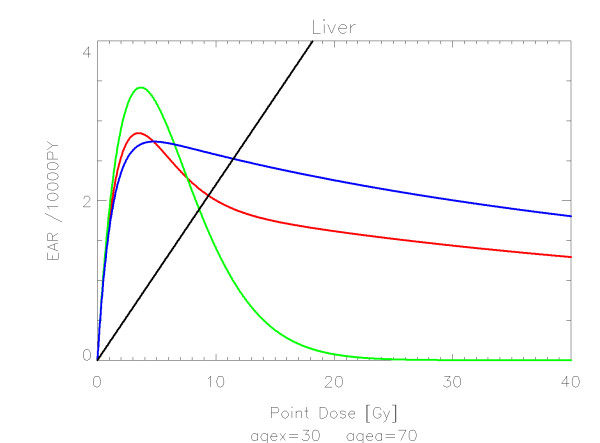
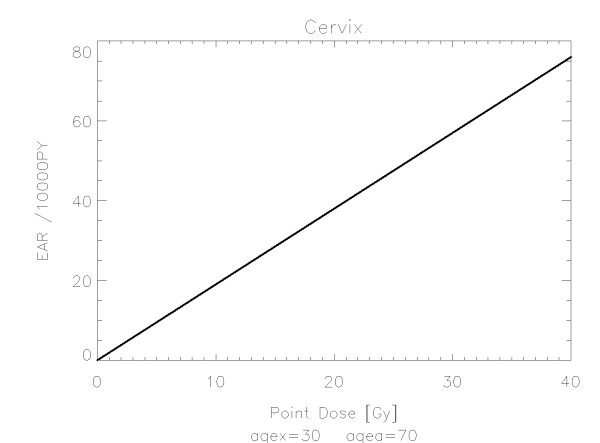
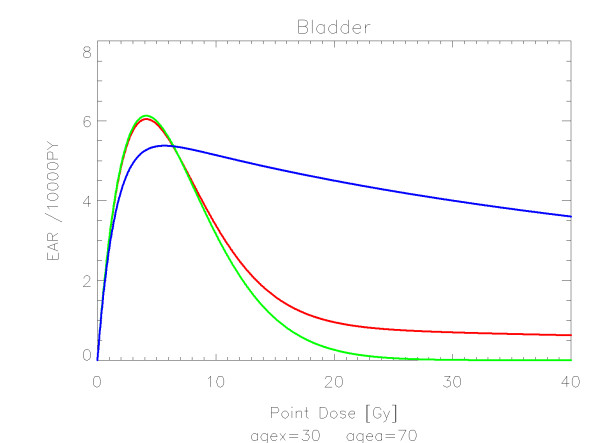
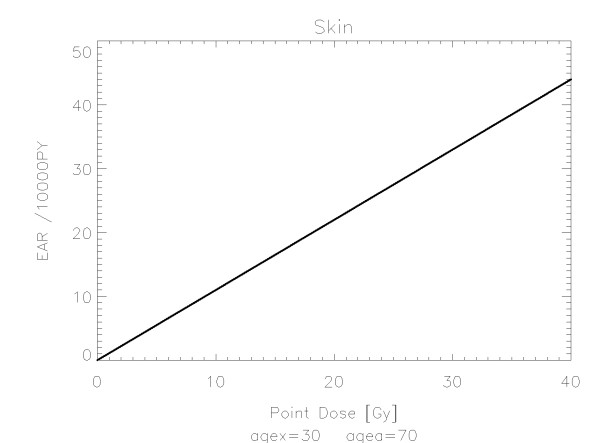
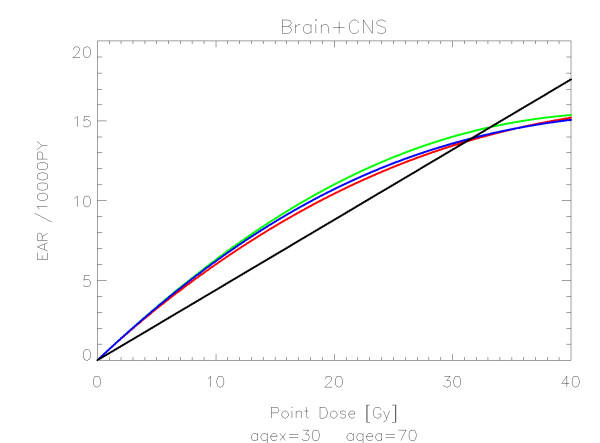
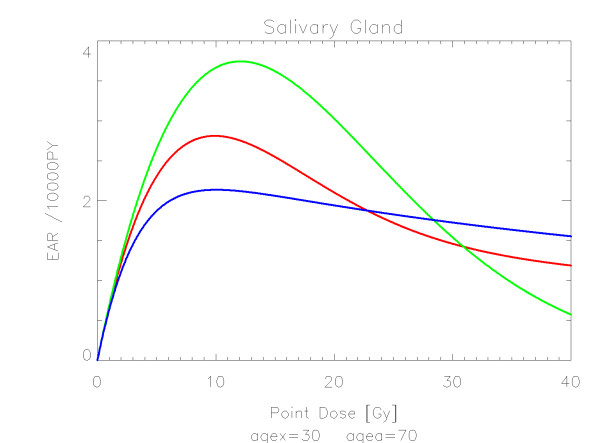
Materials and methods: For various organs and tissues the analysis of cancer induction was extended by an attempted combination of the linear-no-threshold model from the A-bomb survivors in the low dose range and the cancer risk data of patients receiving radiotherapy for Hodgkin's disease in the high dose range. The data were fitted using organ equivalent dose (OED) calculated for a group of different dose-response models including a linear model, a model including fractionation, a bell-shaped model and a plateau-dose-response relationship.

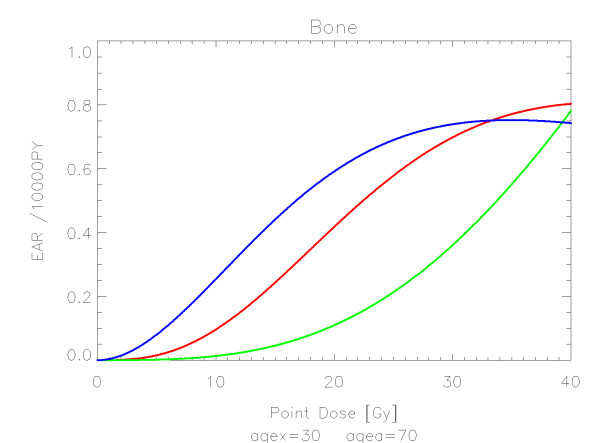
Results: The quality of the applied fits shows that the linear model fits best colon, cervix and skin. All other organs are best fitted by the model including fractionation indicating that the repopulation/repair ability of tissue is neither 0 nor 100% but somewhere in between. Bone and soft tissue sarcoma were fitted well by all the models. In the low dose range beyond 1 Gy sarcoma risk is negligible. For increasing dose, sarcoma risk increases rapidly and reaches a plateau at around 30 Gy.

Conclusions: In this work OED for various organs was calculated for a linear, a bell-shaped, a plateau and a mixture between a bell-shaped and plateau dose-response relationship for typical treatment plans of Hodgkin's disease patients. The model parameters (α and R) were obtained by a fit of the dose-response relationships to these OED data and to the A-bomb survivors. For any three-dimensional inhomogenous dose distribution, cancer risk can be compared by computing OED using the coefficients obtained in this work.


Figures

Figure 1
Figure 1
Plot of excess absolute carcinoma risk for all solid cancers per 10,000 persons per year as a function of point dose in the organ. The bell-shaped, plateau and full dose-response relationships are depicted by the green, blue and red line, respectively. The fits are presented for age at exposure of 30 years and attained age of 70 years.
Figure 2
Figure 2
Plot of excess absolute carcinoma risk for female breast cancer per 10,000 persons per year as a function of point dose in the organ. The bell-shaped, plateau and full dose-response relationships are depicted by the green, blue and red line, respectively. The magenta curve represents the results from a fits to case control studies [23]. The fits are presented for age at exposure of 30 years and attained age of 70 years.
Figure 3
Figure 3
Plot of excess absolute carcinoma risk for lung cancer per 10,000 persons per year as a function of point dose in the organ. The bell-shaped, plateau and full dose-response relationships are depicted by the green, blue and red line, respectively. The magenta curve represents the results from a fits to case control studies [27]. The fits are presented for age at exposure of 30 years and attained age of 70 years.
Figure 4
Figure 4
Plot of excess absolute carcinoma risk for colon cancer per 10,000 persons per year as a function of point dose in the organ. The linear, bell-shaped, plateau and full dose-response relationships are depicted by the black, green, blue and red line, respectively. The fits are presented for age at exposure of 30 years and attained age of 70 years.
Figure 5
Figure 5
Plot of excess absolute carcinoma risk for cancers of the mouth and pharynx per 10,000 persons per year as a function of point dose in the organ. The bell-shaped, plateau and full dose-response relationships are depicted by the green, blue and red line, respectively. The fits are presented for age at exposure of 30 years and attained age of 70 years.
Figure 6
Figure 6
Plot of excess absolute carcinoma risk for stomach cancer per 10,000 persons per year as a function of point dose in the organ. The bell-shaped and full dose-response relationships are depicted by the green and red line, respectively. The fits are presented for age at exposure of 30 years and attained age of 70 years.
Figure 7
Figure 7
Plot of excess absolute carcinoma risk for cancer of the small intestine per 10,000 persons per year as a function of point dose in the organ. The bell-shaped and full dose-response relationships are depicted by the green and red line, respectively. The fits are presented for age at exposure of 30 years and attained age of 70 years.
Figure 8
Figure 8
Plot of excess absolute carcinoma risk for liver cancer per 10,000 persons per year as a function of point dose in the organ. The linear, bell-shaped, plateau and full dose-response relationships are depicted by the black, green, blue and red line, respectively. The fits are presented for age at exposure of 30 years and attained age of 70 years.
Figure 9
Figure 9
Plot of excess absolute carcinoma risk for cervix cancer per 10,000 persons per year as a function of point dose in the organ. The linear dose-response relationship is depicted by the black line. The fit is presented for age at exposure of 30 years and attained age of 70 years.
Figure 10
Figure 10
Plot of excess absolute carcinoma risk for bladder cancer per 10,000 persons per year as a function of point dose in the organ. The bell-shaped, plateau and full dose-response relationships are depicted by the green, blue and red line, respectively. The fits are presented for age at exposure of 30 years and attained age of 70 years.
Figure 11
Figure 11
Plot of excess absolute carcinoma risk for skin cancer per 10,000 persons per year as a function of point dose in the organ. The linear dose-response relationship is depicted by the black line. The fit is presented for age at exposure of 30 years and attained age of 70 years.
Figure 12
Figure 12
Plot of excess absolute carcinoma risk for cancer of the brain and CNS per 10,000 persons per year as a function of point dose in the organ. The linear, bell-shaped, plateau and full dose-response relationships are depicted by the black, green, blue and red line, respectively. The fits are presented for age at exposure of 30 years and attained age of 70 years.
Figure 13
Figure 13
Plot of excess absolute carcinoma risk for cancer of the salivary glands per 10,000 persons per year as a function of point dose in the organ. The bell-shaped, plateau and full dose-response relationships are depicted by the green, blue and red line, respectively. The fits are presented for age at exposure of 30 years and attained age of 70 years.
Figure 14
Figure 14
Plot of excess absolute risk for sarcoma incidence in bone per 10,000 persons per year as a function of point dose in the organ. The dose-response relationships representing low, intermediate, and full repopulation/repair are depicted by the green, red and blue line, respectively. The fits are presented for age at exposure of 30 years and attained age of 70 years.
Figure 15
Figure 15
Plot of excess absolute risk for sarcoma incidence in soft tissue per 10,000 persons per year as a function of point dose in the organ. The dose-response relationships representing low, intermediate, and full repopulation/repair are depicted by the green, red and blue line, respectively. The fits are presented for age at exposure of 30 years and attained age of 70 years.

References

    1. Preston DL, Ron E, Tokuoka S, Funamoto S, Nishi N, Soda M, Mabuchi K, Kodama K. Solid cancer incidence in atomic bomb survivors: 1958-1998. Radiat Res. 2007;168(1):1–64. doi: 10.1667/RR0763.1. - DOI - PubMed
    1. Preston DL, Pierce DA, Shimizu Y, Cullings HM, Fujita S, Funamoto S, Kodama K. Effects of recent changes in Atomic bomb survivor dosimetry on cancer mortality risk estimated. Radiat Res. 2004;162:377–389. doi: 10.1667/RR3232. - DOI - PubMed
    1. Walsh L, Rühm W, Kellerer AM. Cancer risk estimates for X-rays with regard to organ specific doses, part I: All solid cancers combined. Radiat Environ Biophys. 2004;43:145–151. doi: 10.1007/s00411-004-0248-5. - DOI - PubMed
    1. Walsh L, Rühm W, Kellerer AM. Cancer risk estimates for γ-rays with regard to organ specific doses, part II: Site specific solid cancers. Radiat Environ Biophys. 2004;43:225–231. doi: 10.1007/s00411-004-0263-6. - DOI - PubMed
    1. Lindsay KA, Wheldon EG, Deehan C, Wheldon TE. Radiation carcinogenesis modelling for risk of treatment-related second tumours following radiotherapy. Br J Radiol. 2001;74(882):529–36. - PubMed

Publication types