. 2011 Jul 28;71(2):243-9.
doi: 10.1016/j.neuron.2011.05.040.

Differences between neural activity in prefrontal cortex and striatum during learning of novel abstract categories

Affiliations

Differences between neural activity in prefrontal cortex and striatum during learning of novel abstract categories

Evan G Antzoulatos et al. Neuron. .

Abstract

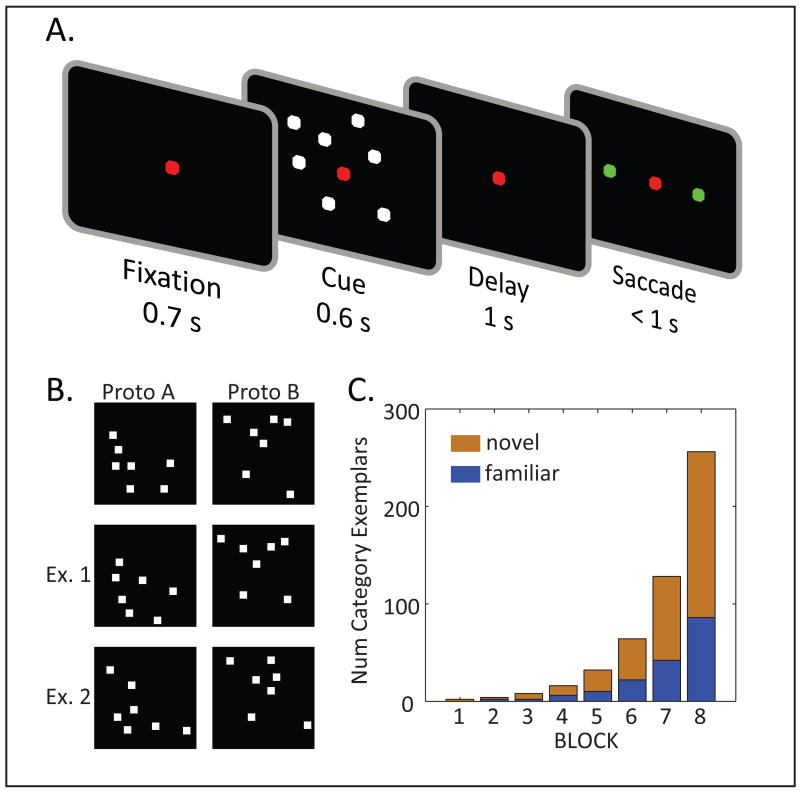
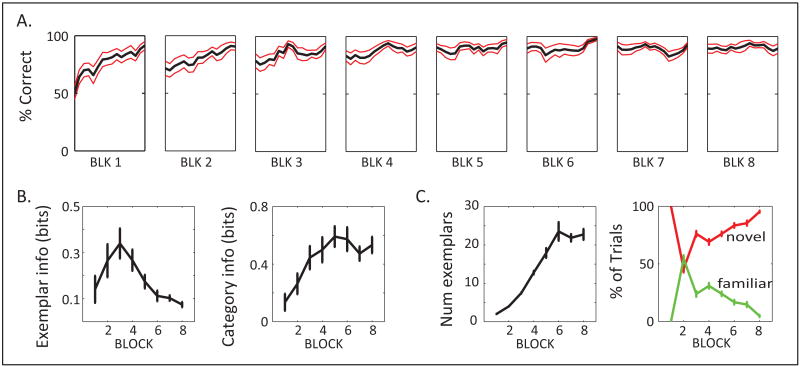
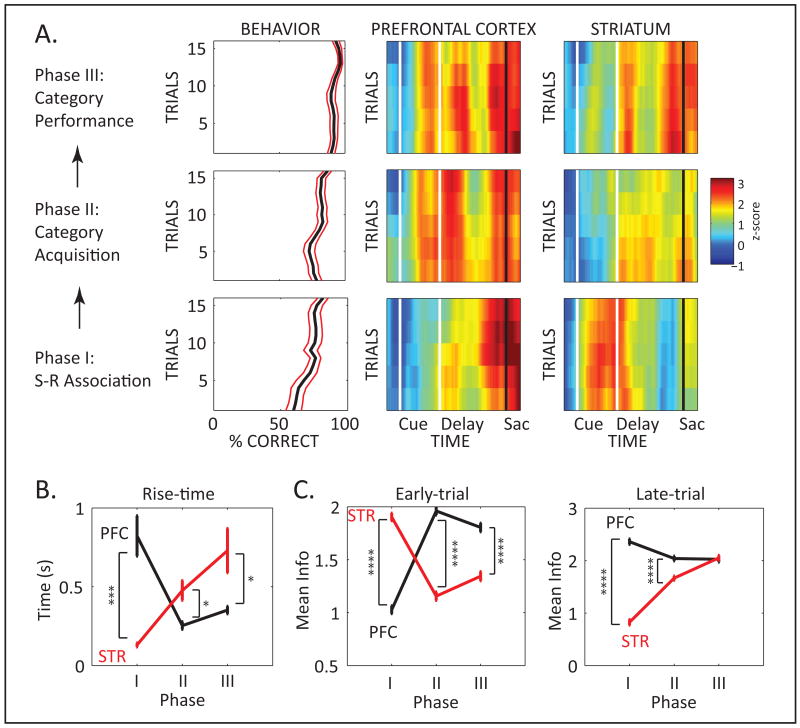
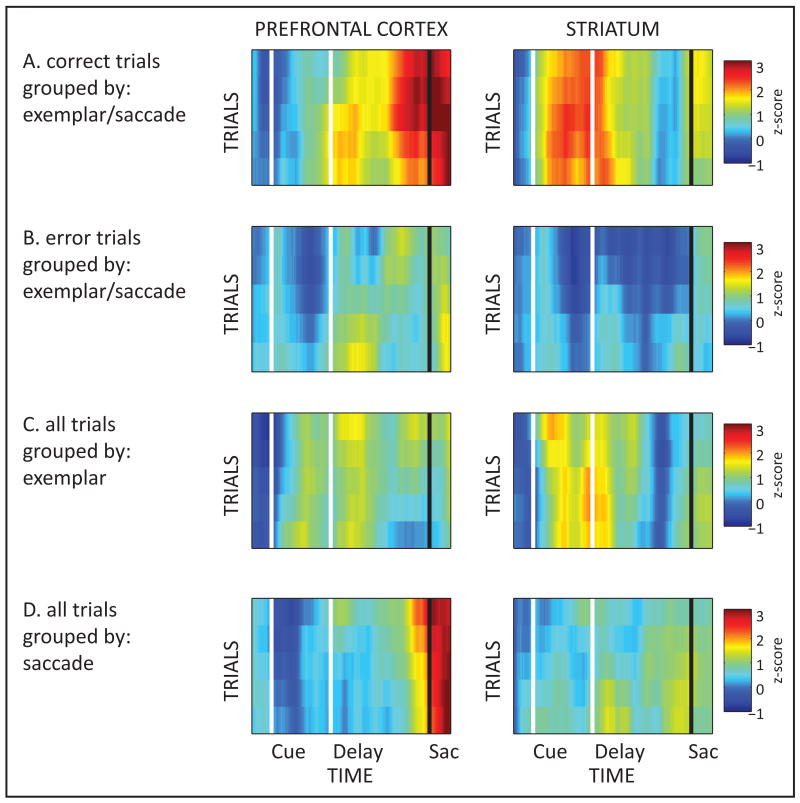
Learning to classify diverse experiences into meaningful groups, like categories, is fundamental to normal cognition. To understand its neural basis, we simultaneously recorded from multiple electrodes in lateral prefrontal cortex and dorsal striatum, two interconnected brain structures critical for learning. Each day, monkeys learned to associate novel abstract, dot-based categories with a right versus left saccade. Early on, when they could acquire specific stimulus-response associations, striatum activity was an earlier predictor of the corresponding saccade. However, as the number of exemplars increased and monkeys had to learn to classify them, PFC activity began to predict the saccade associated with each category before the striatum. While monkeys were categorizing novel exemplars at a high rate, PFC activity was a strong predictor of their corresponding saccade early in the trial before the striatal neurons. These results suggest that striatum plays a greater role in stimulus-response association and PFC in abstraction of categories.


Figures

Figure 1
Figure 1. A Task of Abstract Category Learning
A. After an initial fixation period, a randomly chosen exemplar of category A or B was shown. Following a brief delay interval, the animal had to classify the exemplar by choosing between a saccade to the left or right target. B. Example stimuli: Top row of panels illustrates two example prototypes, and the other two rows illustrate two exemplars from each category. C. The first block included a single exemplar per category, and on every block, the number of category exemplars was doubled. All exemplars were included in the pool of only two consecutive blocks. “Familiar” (blue) indicates exemplars that were shared between each block and its previous one; “novel” (red) indicates those first introduced in that block.
Figure 2
Figure 2. Behavioral Indices of Category Abstraction
A. Across-trial performance on novel exemplars is averaged across all sessions (n=19) for each block separately (First 16 trials per block; red lines indicate SEM). B. Average mutual information (bits) across blocks, between saccade choice and either exemplar identity (left), or category membership (right). C. Left: The average number of exemplars performed in each block gradually increased, until it reached asymptote in the last 3 blocks when the animals were reaching criterion before all exemplars could be tested. Right: Percentage of trials that tested novel exemplars (red line) vs. familiar exemplars (green line). Except for block 2, where both were at approx. 50%, the novel outnumbered the familiar exemplars. All error bars are SEM. (See also Fig. S1.)
Figure 3
Figure 3. Dynamics of Information Processing in Prefrontal Cortex and Striatum during Category Abstraction
A. Left column of panels illustrates average behavioral performance (±SEM) across trials. The other 2 columns illustrate neural information for the PFC (middle) and striatum (STR; right) neural populations, across trials (y axis) and time (x axis). The fixation, cue, delay, and saccade epochs (also seen in Fig. 1A) are delimited by vertical lines. Information was computed in the same trial segment as behavioral performance, but in a sliding trial × time window. Bottom row of panels: S-R Association phase. Middle row: Category Acquisition phase. Top row: Category Performance phase. B. Average (±SEM) rise-time across trials, for PFC (black) and STR (red) in each of the three experimental phases shown in A. C. Average (±SEM) information in the PFC and STR neural populations in the early (left) and the late (right) epochs of the trial. (See also Figure S3.)
Figure 4
Figure 4. Error-trial analyses of S-R Association Phase
A. Same as bottom row of Fig. 3A: Neural information across trials and time in PFC (left) and STR (right) on correct trials only and error trials only (B). On both corrects and errors, monkeys execute a right or left saccade; the only difference are the exemplars. C. Same analysis, but on pooled correct and error trials. The trials are grouped according to the tested exemplar. D. Same as in C, but grouped according to saccade choice.

References

    1. Asaad WF, Rainer G, Miller EK. Neural activity in the primate prefrontal cortex during associative learning. Neuron. 1998;21:1399–1407. - PubMed
    1. Ashby FG, Maddox WT. Human category learning 2.0. Ann N Y Acad Sci 2010 - PMC - PubMed
    1. Blough DS. Discrimination of letters and random dot patterns by pigeons and humans. Journal of experimental psychology. Animal behavior processes. 1985;11:261–280. - PubMed
    1. Cromer JA, Machon M, Miller EK. Rapid Association Learning in the Primate Prefrontal Cortex in the Absence of Behavioral Reversals. J Cogn Neurosci 2010a - PMC - PubMed
    1. Cromer JA, Roy JE, Miller EK. Representation of multiple, independent categories in the primate prefrontal cortex. Neuron. 2010b;66:796–807. - PMC - PubMed

Publication types

LinkOut - more resources