. 2011 Jul 28;71(2):278-90.
doi: 10.1016/j.neuron.2011.05.036.

Endocytosis promotes rapid dopaminergic signaling

Affiliations

Endocytosis promotes rapid dopaminergic signaling

Sarah J Kotowski et al. Neuron. .

Abstract

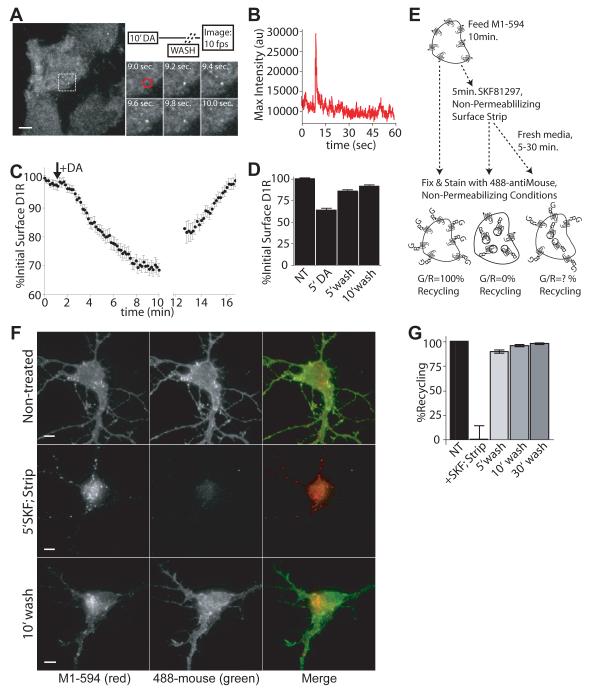
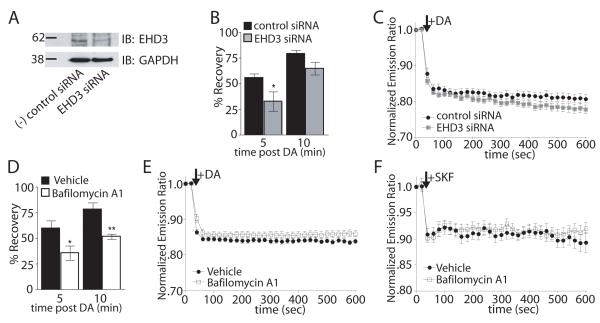
D(1) dopamine receptors are primary mediators of dopaminergic signaling in the CNS. These receptors internalize rapidly following agonist-induced activation, but the functional significance of this process is unknown. We investigated D(1) receptor endocytosis and signaling in HEK293 cells and cultured striatal neurons using real-time fluorescence imaging and cAMP biosensor technology. Agonist-induced activation of D(1) receptors promoted endocytosis of receptors with a time course overlapping that of acute cAMP accumulation. Inhibiting receptor endocytosis blunted acute D(1) receptor-mediated signaling in both dissociated cells and striatal slice preparations. Although endocytic inhibition markedly attenuated acute cAMP accumulation, inhibiting the subsequent recycling of receptors had no effect. Further, D(1) receptors localized in close proximity to endomembrane-associated trimeric G protein and adenylyl cyclase immediately after endocytosis. Together, these results suggest a previously unanticipated role of endocytosis, and the early endocytic pathway, in supporting rapid dopaminergic neurotransmission.


Figures

Figure 1
Figure 1. Rapid agonist-stimulated D1 receptor endocytosis and real-time examination of receptor-mediated regulation of cellular cAMP
(A) Agonist-induced effects on surface receptor number as analyzed by fluorescence flow cytometry. Surface fluorescence of labeled FD1Rs measured at time 0 was defined as 100%. Data = mean fluorescence values +/− SEM, n = 3, 10,000 cells/condition, each time point in duplicate. (B) Representative images of SpH-D1R surface fluorescence visualized by TIRF microscopy prior to (left, inset) and 120 sec. after DA addition (right, inset). (C) Maximum intensity trace of representative SpH-D1R endocytic cluster vs. time. Trace represents area outlined in blue in (B), measurements taken every 4 sec. (D) Normalized integrated surface fluorescence of SpH-D1R measured every 3 sec. in the absence of agonist (Bleaching Control, n = 5 cells) or in response to DA (10μM DA, n = 20 cells). Integrated fluorescence value at time 0 was defined as 100%. Data = mean +/− SEM. (E) Representative pseudo-color image of Epac1-cAMP prior to (left) or 60 sec. after 10μM DA addition (right). Lookup table is scaled linearly to YFP/CFP emission ratio. (F) Change in normalized Epac1-cAMPs FRET signal in response to stimulation over a range of DA concentrations. Data = mean +/− SEM normalized FRET emission ratio at each time point, n = 8-16 cells per dose. Scale bars = 5μm. See also Figure S1.
Figure 2
Figure 2. Endocytic inhibitors reduce acute, D1 receptor-mediated, cAMP accumulation in HEK 293 cells
(A) Subcellular distribution of surface-labeled FD1Rs in response to 10μM DA in the absence (left) or presence (right) of 80μM dynasore. (B) Agonist-induced effects on surface receptor number in the presence of 80μM dynasore (white) or 0.2%DMSO (black) as analyzed by fluorescence flow cytometry. Fluorescence measured at time 0 was defined as 100%. Data = mean surface fluorescence +/− SEM, n = 3, 10,000 cells/condition, each time point in triplicate. (C) Change in normalized Epac1-cAMPs FRET in response to 10μM DA in the presence of 80μM dynasore (open squares) or 0.2% DMSO (Vehicle; filled black circles). Data = mean +/− SEM normalized FRET ratio at each time point, n = 21-22 cells per group. (D) Representative (n = 3) immunoblot analysis of siRNA mediated knockdown of clathrin in FD1R-expressing cells with GAPDH loading control. (E) Agonist-induced effects on surface receptor number for cells transfected with clathrin siRNA (crosshatch) or non-silencing control siRNA (black) as analyzed by fluorescence flow cytometry. Fluorescence measured at time 0 was defined as 100%. Data = mean surface fluorescence +/− SEM, n = 3, 10,000 cells/condition, each time point in triplicate. (F) Change in normalized Epac1-cAMPs FRET in response to 10μM DA in cells transfected with clathrin siRNA (open triangles) or non-silencing control siRNA (filled circles). Data = mean +/− SEM normalized FRET ratio at each time point, n = 14-15 cells per group. (G) Agonist-induced effects on surface receptor number for cells expressing wild-type (black) or 360-382 deletion mutant D1 receptors (grey), as analyzed by fluorescence flow cytometry. Fluorescence measured at t = 0 was defined as 100%. Data = mean surface fluorescence +/− SEM, n = 3, 10,000 cells/condition, each time point in triplicate. (H) Change in normalized Epac1-cAMPs FRET in response to 10μM DA in cells expressing wild-type (closed circles) or 360-382 deletion mutant D1Rs (grey squares). Data = mean +/− SEM normalized FRET emission ratio at each time point, n = 30-31 cells per group. (I) Mean difference in cAMP response between each endocytic manipulation and corresponding control at 20 sec. (black) or 120 sec. (white) after DA addition. Data = difference in mean normalized FRET ratio +/− variance at each time point. Scale bar = 5 μm. (*p<0.05, **p<0.01 by 2-tailed unpaired t-test) See also Figure S2.
Figure 3
Figure 3. Rapid, agonist-induced trafficking of D1 receptors in striatal neurons
(A) Representative, epifluorescence images of FD1R-expressing striatal neurons after 10 min. incubation with (bottom) or without (top) of 1μM SKF 81297. (B) The total pool of FD1Rs initially present at the cell surface were labeled with Alexa594-conjugated primary antibody (red). After agonist treatment, neurons were fixed under non-permeabilizing conditions and incubated with Alexa488-conjugated secondary antibody (green) to label receptors that remained at the cell surface or recycled during the incubation period. (B) Quantification of FD1R internalization by change in normalized (surface/total) fluorescence ratio as described in (A). The average surface to total (green/red) fluorescence ratio measured in non-treated cells was defined as 1. Data = mean fluorescence ratios +/-SEM, n = 3, 31-36 cells per condition. (C) Representative images of SpH-D1R surface fluorescence in striatal neurons as visualized by TIRF microscopy prior to (left, inset), and 120 sec. after SKF 81297 addition (right, inset). Arrows indicate clusters of SpH-D1R fluorescence that formed after SKF addition and disappeared shortly thereafter, arrowhead indicates a cluster of that formed after SKF addition and persisted throughout imaging. (D) Kymograph of SpH-D1R fluorescence for endocytic events indicated by arrows in (C). Kymograph depicts surface fluorescence intensity (maximum intensity determination) as a function of time. Arrow indicates bath application of 1μM SKF 81297. (E) Average surface fluorescence of SpH-D1R expressing striatal neurons measured every 3 sec. in the absence of (Bleaching Control) or in response to 1μM SKF 81297. Initial fluorescence values normalized to 100%, data = background-corrected, mean surface fluorescence +/− SEM, n = 5-9 cells/condition. Scale bars = 5μm. See also Figure S3.
Figure 4
Figure 4. Endocytic inhibition reduces acute D1 receptor-mediated cAMP accumulation in striatal neurons
(A) Pseudo-color representation of Epac1-cAMP FRET in FD1R/Epac1-cAMPs expressing striatal neuron prior to (left) or 60 sec after addition of 1μM SKF 81297 (right). Lookup table is scaled linearly to YFP/CFP emission ratio. (B) Change in normalized Epac1-cAMPs FRET signal in response to stimulation with 1μM SKF 81297. Data = mean normalized FRET emission ratio +/− SEM at each time point, n = 7. (C) Change in normalized Epac1-cAMPs FRET in response to 1μM SKF 81297 in the presence of 80μM dynasore (open squares) or 0.2% DMSO (Vehicle; filled circles). Data represent mean normalized FRET emission ratio +/− SEM at each time point, n = 13-18 cells per group. (D) Change in normalized Epac1-cAMPs FRET in response to 1μM SKF 81297 in cells expressing wild-type (filled circles) or 360-382 deletion mutant D1Rs (open diamonds). Data = mean normalized FRET emission ratio +/− SEM at each time point, n = 12-15 cells per group. (*p<0.05, **p<0.01 by 2-tailed unpaired t-test) Scale bar = 5μm. See also Figure S4.
Figure 5
Figure 5. Dynasore prevents D1 receptor-mediated enhancement of action potential firing in lateral dorsal striatal neurons in brain slice
(A) Example traces showing increased firing with the D1 receptor agonist SKF81297 (10μM) after pre-exposure to vehicle (0.2% DMSO), but not 80μM dynasore. Slices were incubated as indicated (bar in panel B) with either vehicle (0.2% DMSO, top pair of traces) or 80 μM dynasore (bottom pair of traces) prior to delivery of SKF81297. (B) Grouped data showing significant increase in firing with SKF81297 after pre-exposure to vehicle (34.7 +/− 12.8%, n=5) but not dynasore (−2.78 +/− 4.9%, n=5). Bars indicate the time course of drug perfusions relative to changes in AP firing. The percent change in number of action potentials (APs) generated relative to baseline was determined at the current step at baseline with 4 APs, or 5 APs. If no current steps at baseline had 4 APs, the baseline number of APs was determined by averaging each min for the 4 minutes before addition of DMSO or dynasore (*p<0.05 by 2-tailed unpaired t-test). See also Figure S5.
Figure 6
Figure 6. D1 receptors rapidly recycle after endocytosis
(A) Experimental schematic and representative images of SpH-D1R surface insertion events visualized by TIRF microscopy. Images acquired at 10 Hz after DA washout. (B) Maximum intensity trace of a representative SpH-D1R insertion event (red circle in A) vs. time. (C) Integrated surface fluorescence of plasma membrane SpH-D1R before and after DA addition and washout, as detected by TIRF imaging. Arrow indicates application of 10μM DA and gap indicates period of agonist washout. Data = mean integrated fluorescence values for each cell at a given time point +/− SEM, normalized to t = 0, n = 10. (D) Agonist-induced reduction and recovery of surface FD1R immunoreactivity determined by fluorescence flow cytometry. Surface FD1R immunoreactivity was determined in cells not exposed to agonist (NT), after 5 min incubation with 10μM DA (5′DA), or 5 min. DA followed by agonist washout and incubation in fresh media for 5 or 10 min. (5′wash, 10′wash). Data = mean surface FD1R fluorescence +/− SEM, normalized to the NT condition (defined as 100%) n = 3, 10,000 cells/condition, each condition in duplicate. (E) Experimental schematic to quantify recycling of internalized FD1Rs in striatal neurons by dual labeling and fluorescence ratio imaging. (F) Representative epifluorescence images obtained using the dual labeling procedure described in (E). (G) Quantification of FD1 receptor recycling across multiple neurons by fluorescence ratio imaging (see Experimental Procedures). Bars = mean percentage of internalized receptors that recycle 0 (+SKF;Strip), 5, 10 or 30 minutes after agonist washout, +/− SEM. 100% recycling = green to red fluorescence ratio measured in unstimulated neurons, 0% recycling = green to red fluorescence ratio in neurons treated with SKF for 5 min., stripped and immediately fixed. n = 3, 21-27 cells per group. Scale bars = 5μm.
Figure 7
Figure 7. Inhibiting recycling does not affect acute D1 receptor-mediated cAMP accumulation
(A) Representative (n = 3) immunoblot analysis of siRNA mediated knockdown of EHD3 in FD1R-expressing HEK293 cells with GAPDH loading control. (B) Recovery of surface FD1Rs measured by fluorescence flow cytometry. Recovery of surface FD1R fluorescence after 5 min DA incubation and 5 or 10 min after agonist washout was measured in cells transfected with siRNA targeting EHD3 (gray) or non-silencing control siRNA (black). %Recovery = [(Surface fluorescence after DA washout - average surface fluorescence after 5 min. DA incubation)/(average initial surface fluorescence - average surface fluorescence after 5 min. DA incubation)] × 100. Data = mean %Recovery +/− SEM, n = 3, 10,000 cells/well, each time point in triplicate. (C) Change in normalized Epac1-cAMPs FRET in response to 10μM DA in cells transfected with siRNA against EHD3 (grey squares) or non-silencing control siRNA (filled circles). Data = mean normalized FRET emission ratio at each time point +/− SEM, n = 20-28 cells per group. (D) Recovery of FD1Rs in the presence of 500nM Bafilomycin (white bars) or vehicle (black bars) as measured by fluorescence flow cytometry. Data = mean %Recovery +/− SEM, n = 3, 10,000 cells/well, each time point in triplicate. (E) Change in normalized Epac1-cAMPs FRET in response to 10μM DA in cells pretreated with Bafilomycin (open squares) or vehicle control (filled circles). Data = mean normalized FRET emission ratio at each time point +/− SEM, n = 29-30 cells per group. (F) Change in normalized Epac1-cAMPs FRET in response to 1μM SKF81927 in FD1 expressing striatal neurons pretreated with bafilomycin (open squares) or vehicle control (filled circles). Data = mean normalized FRET emission ratio at each time point +/− SEM, n = 11-14 neurons per group. (*p<0.05, **p<0.01, 2-tailed unpaired t-test).
Figure 8
Figure 8. Rapid endocytosis promotes colocalization of D1 receptors with ACV and Gs/olf
(A) Representative confocal sections of FD1R (left, red) and ACV (center, green) immunoreactivity from striatal neurons incubated in the absence (top) or 2 min. after 1μM SKF81297 application (bottom). (B) Quantification of the fraction of D1R positive puncta that colocalize with ACV prior to (black) and after (white) 1μM SKF81297 addition. n = 4, 3-6 cells per condition. (C) Representative confocal optical sections of FD1R (left, red) and Gαs/olf (center, green) immunoreactivity from striatal neurons incubated in the absence of agonist (top) or 2 min. after 1μM SKF81297 application (bottom panel). (D) Quantification of the fraction of D1R positive puncta that colocalize with Gαs/olf prior to (black) and after (white) bath application of 1μM SKF81297 n = 4, 4-5 cells per condition. (*p<0.05, **p<0.01, unpaired t-test) (E) Proposed model of endocytosis-dependent augmentation of acute dopaminergic signaling. Activation of D1 areceptors stimulates ACV via receptor coupling to Gs/olf in the plasma membrane, creating an initial burst of cAMP production. Activated D1 receptors are rapidly concentrated in clathrin-coated pits, which undergo dynamin-dependent endocytosis and rapid uncoating. Additional cAMP is then generated from a nascent endocytic membrane compartment associated with Gs/olf and ACV. Endocytic membranes subsequently fuse with classical sorting endosomes that are not signaling-competent and receptors are inactivated by agonist dissociation in the increasingly acidic endosomal environment. Efficient trafficking of internalized D1 receptors back to the plasma membrane requires the vacuolar ATPase mediating continued endosomal acidification and EHD3 mediating membrane transfer from early to recycling endosomes. Manipulations that disrupt the function or trafficking through later sorting compartments (Bafilomycin, siRNA vs. EHD3) do not affect the magnitude of the acute cAMP response. Manipulations that interfere events initiating entry of activated D1 receptors into the endomembrane system (HS, dynasore, siRNA vs. clathrin, Δ360-382) inhibit acute cAMP signaling by preventing the second burst of cAMP production in this dynamic trafficking cycle.

References

    1. Abdallah L, Bonasera SJ, Hopf FW, O’Dell L, Giorgetti M, Jongsma M, Carra S, Pierucci M, Di Giovanni G, Esposito E, et al. Impact of Serotonin 2C Receptor Null Mutation on Physiology and Behavior Associated with Nigrostriatal Dopamine Pathway Function. J Neurosci. 2009;29:8156–8165. - PMC - PubMed
    1. Ariano MA, Sortwell CE, Ray M, Altemus KL, Sibley DR, Levine MS. Agonist-induced morphologic decrease in cellular d1A dopamine receptor staining. Synapse. 1997;27:313–321. - PubMed
    1. Bloch B, Bernard V, Dumartin B. “In vivo” intraneuronal trafficking of G protein coupled receptors in the striatum: regulation by dopaminergic and cholinergic environment. Biology of the Cell. 2003;95:477–488. - PubMed
    1. Bradberry CW, Barrett-Larimore RL, Jatlow P, Rubino SR. Impact of Self-Administered Cocaine and Cocaine Cues on Extracellular Dopamine in Mesolimbic and Sensorimotor Striatum in Rhesus Monkeys. J Neurosci. 2000;20:3874–3883. - PMC - PubMed
    1. Calebiro D, Nikolaev VO, Gagliani MC, de Filippis T, Dees C, Tacchetti C, Persani L, Lohse MJ. Persistent cAMP-signals triggered by internalized G-protein-coupled receptors. PLoS biology. 2009;7:e1000172. - PMC - PubMed

Publication types

MeSH terms