. 2011 Sep 9;52(10):7180-6.
doi: 10.1167/iovs.11-7716.

Hypodense regions (holes) in the retinal nerve fiber layer in frequency-domain OCT scans of glaucoma patients and suspects

Affiliations

Hypodense regions (holes) in the retinal nerve fiber layer in frequency-domain OCT scans of glaucoma patients and suspects

Daiyan Xin et al. Invest Ophthalmol Vis Sci. .

Abstract

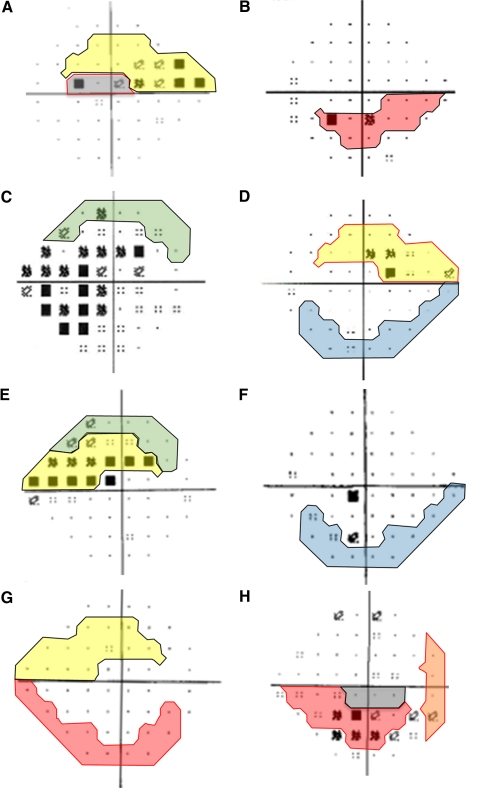
Purpose: To better understand hypodense regions (holes) that appear in the retinal nerve fiber layer (RNFL) of frequency-domain optical coherence tomography (fdOCT) scans of patients with glaucoma and glaucoma suspects.

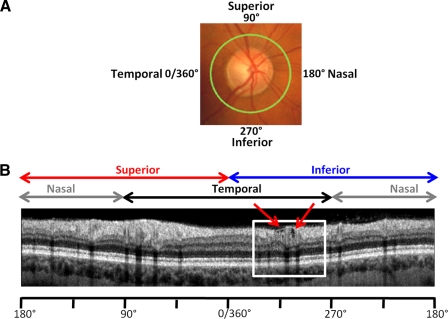
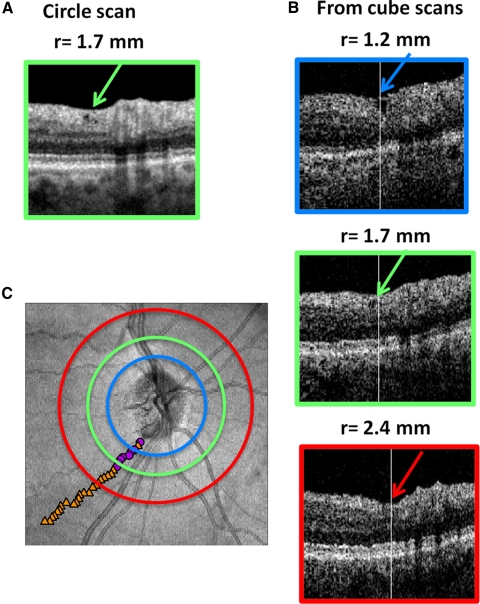
Methods: Peripapillary circle (1.7-mm radius) and cube optic disc fdOCT scans were obtained on 208 eyes from 110 patients (57.4 ± 13.2 years) with glaucomatous optic neuropathy (GON) and 45 eyes of 45 controls (48.0 ± 12.6 years) with normal results of fundus examination. Holes in the RNFL were identified independently by two observers on the circle scans.

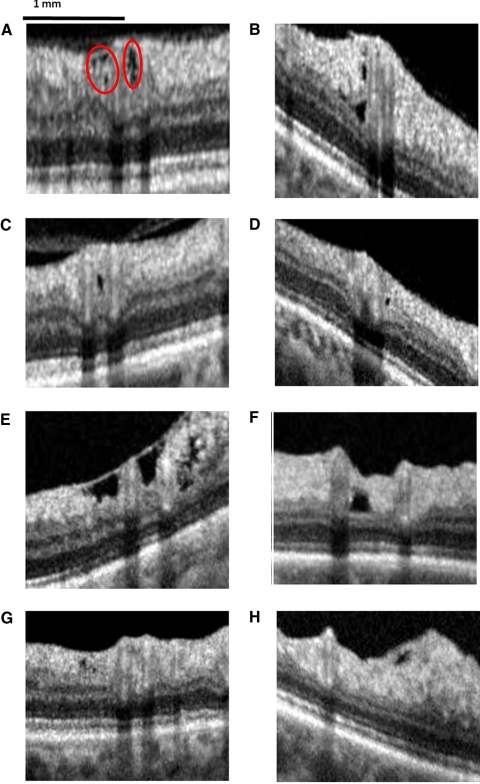
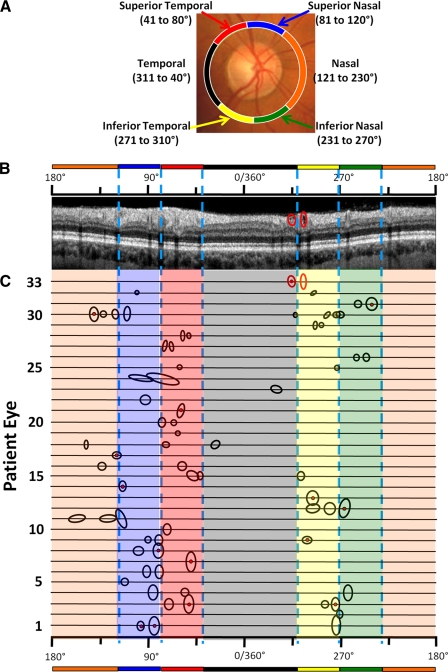
Results: Holes were found in 33 (16%) eyes of 28 (25%) patients; they were not found in any of the control eyes. Twenty-four eyes had more than one hole. Although some holes were relatively large, others were small. In general, the holes were located adjacent to blood vessels; only three eyes had isolated holes that were not adjacent to a vessel. The holes tended to be in the regions that are thickest in healthy controls and were associated with arcuate defects in patients. Holes were not seen in the center of the temporal disc region. They were more common in the superior (25 eyes) than in the inferior (15 eyes) disc. Of the 30 eyes with holes with reliable visual fields, seven were glaucoma suspect eyes with normal visual fields.

Conclusions: The holes in the RNFL seen in patients with GON were probably due to a local loss of RNFL fibers and can occur in the eyes of glaucoma suspects with normal visual fields.


Figures

Figure 1.
Figure 1.
(A) The locus of the fdOCT circle scan (green circle) is shown with a 360° scale to indicate disc location. 0° is the most temporal part of disc and occurs at 9 o'clock for a right eye and 3 o'clock for a left eye. (B) Circle scan of eye 33. White box: region with holes, enlarged in Figure 2A.
Figure 2.
Figure 2.
Examples of holes and clusters of holes in eight eyes: eyes 33 (A), 7 (B), 2 (C), 32 (D), 12 (E), 22 (F), 9 (G), and 18 (H).
Figure 3.
Figure 3.
(A) Similar to Figure 2G. The region from eye 9 showing holes in RNFL on the scan. (B) Comparable region shown for circle scans derived from cube scans using radii smaller than (1.2 mm), the same size as (1.7 mm), and larger than (2.4 mm) than that used for the high-quality circle scan in A. (C) Fundus view of disc showing the location of the three circles. The center of the holes (magenta circles) or depressions (orange triangles) are indicated by the small symbols.
Figure 4.
Figure 4.
Location of holes by patient. (A) Garway-Heath et al. disc sectors. (B) The same circle scan from eye 33 shown in Figures 1 and 2A, with the cluster of holes (left ellipse) and a single hole (right ellipse) enclosed in red ellipses. The location of these holes can be specified in terms of 360° scale and Garway-Heath et al. sectors, as indicated by the scales above the scan. (C) The location of holes or clusters of holes for all 33 eyes. The size of the circle/ellipse denotes the size of the hole or the region of clusters of holes. A cluster is indicated by the red dot in the center of the ellipse.
Figure 5.
Figure 5.
The 24–2 visual fields for the eyes in Figure 2 shown in corresponding panels. The shaded portion of the field is the Garway-Heath et al. field region associated with the disc location of the hole(s). The shaded regions with black borders correspond to the holes shown in Figure 2, and the shaded regions with red borders are associated with other holes seen on the scan from that particular eye.

References

    1. Bowd C, Zangwill LM, Medeiros FA, et al. Structure-function relationships using confocal scanning laser ophthalmoscopy, optical coherence tomography, and scanning laser polarimetry. Invest Ophthalmol Vis Sci. 2006;47:2889–2895 - PubMed
    1. Hood DC, Kardon RH. A framework for comparing structural and functional measures of glaucomatous damage. Prog Retin Eye Res. 2007;26:688–710 - PMC - PubMed
    1. Wang M, Hood DC, Cho J, et al. Measurement of local retinal ganglion cell thickness in patients with glaucoma using frequency-domain optical coherence tomography. Arch Ophthalmol. 2009;127:875–881 - PMC - PubMed
    1. Tan O, Chopra V, Lu AT, Schuman JS, et al. Detection of macular ganglion cell loss in glaucoma by Fourier-domain optical coherence tomography. Ophthalmology. 2009;116:2305–2314 - PMC - PubMed
    1. Raza AS, Cho J, De Moraes CGV, et al. Macular retinal ganglion cell layer thickness and local visual field sensitivity in glaucoma. Arch Ophthalmol. In press - PMC - PubMed

Publication types