. 2011 Oct;31(19):4022-35.
doi: 10.1128/MCB.05289-11. Epub 2011 Jul 26.

Analysis of human syndromes with disordered chromatin reveals the impact of heterochromatin on the efficacy of ATM-dependent G2/M checkpoint arrest

Affiliations

Analysis of human syndromes with disordered chromatin reveals the impact of heterochromatin on the efficacy of ATM-dependent G2/M checkpoint arrest

Holly Brunton et al. Mol Cell Biol. 2011 Oct.

Abstract

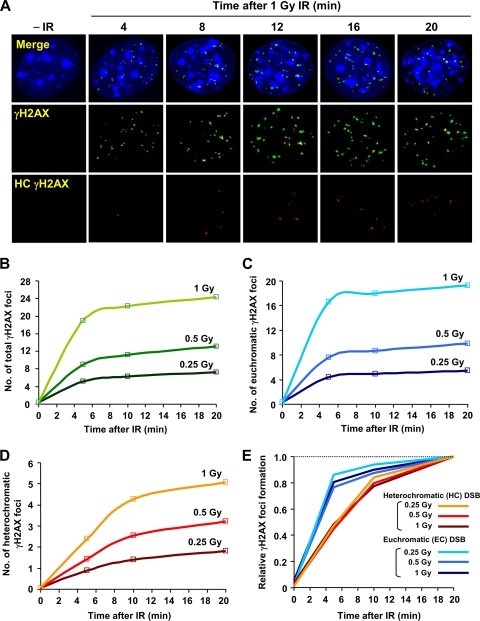
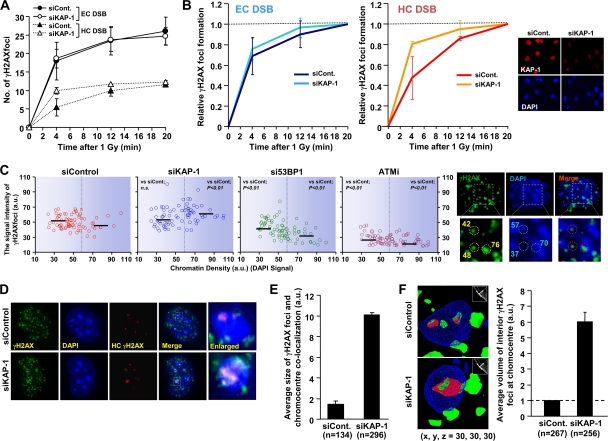
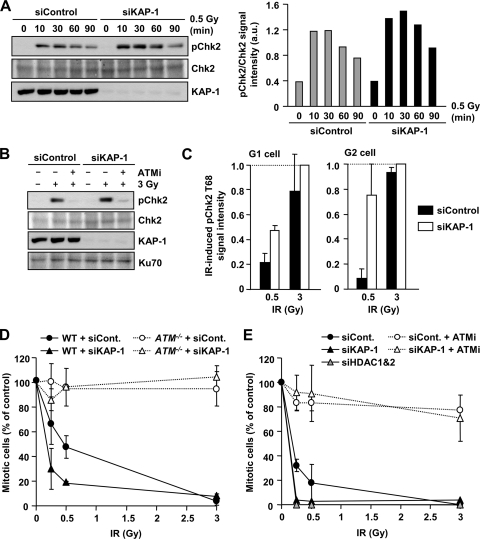
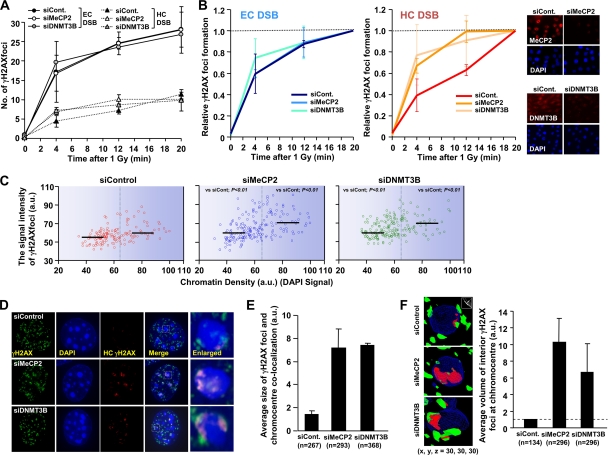
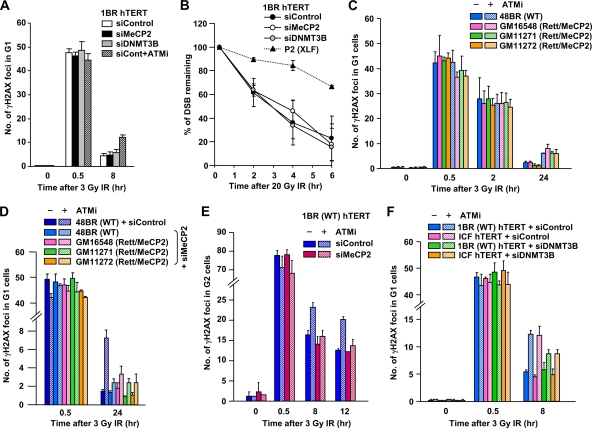
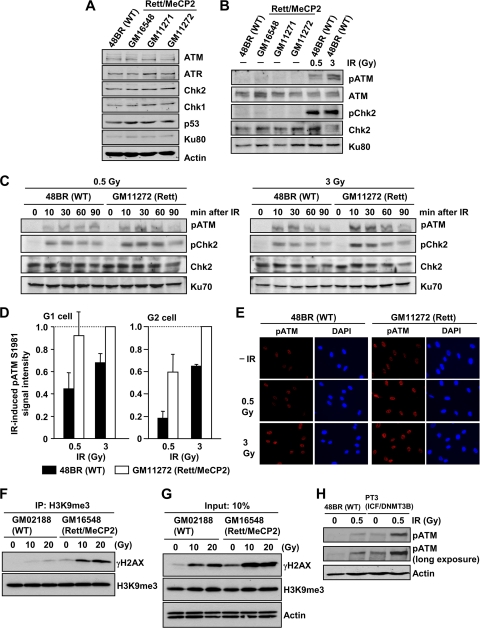
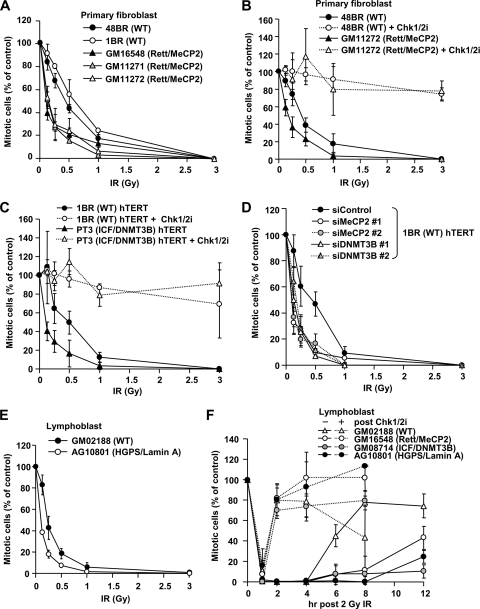
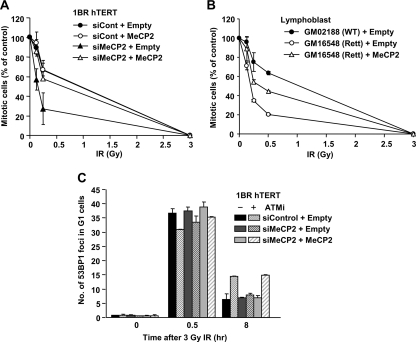
Heterochromatin (HC) poses a barrier to γH2AX focus expansion and DNA double-strand break (DSB) repair, the latter being relieved by ATM-dependent KAP-1 phosphorylation. Using high-resolution imaging, we show here that the HC superstructure markedly restricts ATM signaling to cell cycle checkpoint proteins. The impact of HC is greater than anticipated from the percentage of HC-DNA and, in distinction to DSB repair, ATM only partly overcomes the constraints posed by HC. Importantly, we examine ATM signaling in human syndromes with disordered HC. After depletion of MeCP2 and DNMT3B, proteins defective in the Rett and immunodeficiency with centromere instability and facial anomalies (ICF) syndromes, respectively, we demonstrate enhanced γH2AX signal expansion at HC-chromocenters in mouse NIH 3T3 cells, which have visible HC-chromocenters. Previous studies have shown that the G(2)/M checkpoint is inefficient requiring multiple DSBs to initiate arrest. MeCP2 and DNMT3B depletion leads to hypersensitive radiation-induced G(2)/M checkpoint arrest despite normal DSB repair. Cell lines from Rett, ICF, and Hutchinson-Guildford progeria syndrome patients similarly showed hyperactivated ATM signaling and hypersensitive and prolonged G(2)/M checkpoint arrest. Collectively, these findings reveal that heterochromatin contributes to the previously described inefficient G(2)/M checkpoint arrest and demonstrate how the signaling response can be uncoupled from DSB repair.


Figures

Fig. 1.
Fig. 1.
Rate of γH2AX focus formation at HC and EC regions. (A) Typical images of γH2AX focus formation after IR in NIH 3T3 cells. HC γH2AX (red) represents regions of γH2AX and dense DAPI chromocenter overlap, as determined by softWoRx Suite software. (B to D) The rates of total (B), EC (C), and HC (D), γH2AX focus formation were enumerated after 0.25, 0.5, and 1 Gy of IR. (E) γH2AX focus formation is normalized to the 20 min post-IR signal. Similar results have been obtained in more than three independent experiments (see Fig. 2 and 4).
Fig. 2.
Fig. 2.
Depletion of KAP-1 enhances the speed and expansion of γH2AX signal at HC regions. (A) KAP-1 siRNA increases the speed of HC γH2AX focus formation. KAP-1 siRNA-treated NIH 3T3 cells were irradiated with 1 Gy. The numbers of γH2AX foci overlapping/juxtaposing and nonoverlapping with chromocenters were enumerated as HC and EC foci. (B) The rate of γH2AX focus formation shown in panel A was normalized to the number of foci at 20 min. The KAP-1 knockdown efficiency is shown in right panel. (C) Greater γH2AX signal intensity at higher-density DAPI regions in KAP-1 siRNA-treated cells after IR. KAP-1 siRNA treated NIH 3T3 cells were irradiated with 3 Gy of IR and fixed 30 min later. The signal intensity of γH2AX and DAPI per focus was quantified by using ImageJ. Typical images and values are shown in the right panel. Black bars represent the median. The statistical significance was determined using Student two-tailed t test. (D and E) Increased γH2AX signal expansion at HC regions following KAP-1 siRNA. High-resolution deconvolved z-stacked images in KAP-1-depleted NIH 3T3 cells are shown in panel D. γH2AX signal overlap of with dense DAPI (blue plus green) was visualized as red signal determined by softWoRx Suite software computer analysis. The magnitude of overlap of γH2AX per chromocenter was quantitatively measured by using ImageJ. (F) Depletion of KAP-1 enhances signal expansion into the HC interior. The γH2AX signal expansion into the HC interior is shown by three-dimensional modeling in NIH 3T3 cells. The volume of the interior signal per chromocenter was measured by Huygens Professional, Scientific Volume Imaging. The quantification is shown in the right panel. In panels A to F, G1 cells with negative staining for p-H3 Ser10 were analyzed. S-phase cells, which show extensive γH2AX signal, were excluded. Error bars represent the standard deviations (SD) from two independent experiments (A, B, E, and F). n, number of chromocenters analyzed (E and F).
Fig. 3.
Fig. 3.
KAP-1 depletion enhances ATM signaling and G2/M checkpoint sensitivity. (A) Increased pChk2 is observed following KAP-1 depletion after IR. 1BR (WT) hTERT cells with or without KAP-1 siRNA were exposed to 0.5 Gy IR and harvested at the indicated time points. Quantification of the pChk2 bands normalized by total Chk2 is shown in right panel. Similar results were observed in two additional experiments. (B) IR-induced pChk2 is ATM dependent irrespective of KAP-1 status. 1BR (WT) hTERT cells with or without KAP-1 siRNA were exposed to 3 Gy of IR with or without 10 μM ATM inhibitor and harvested 2 h post-IR. (C) Enhanced pChk2 signal is observed in KAP-1 depleted cells by IF. 1BR (WT) hTERT cells with or without KAP-1 siRNA were fixed and stained with pChk2, CENPF, and DAPI 30 min after IR. The signal intensity was analyzed by using ImageJ. G2-phase cells were identified by CENP-F. Anti-pChk2 antibody specificity was confirmed as described previously (30). The results represent the mean ± the SD from two experiments. (D) KAP-1 siRNA knockdown causes hypersensitive G2/M checkpoint arrest. WT and ATM−/− MEFs were subjected to KAP-1 siRNA. After IR, cells were fixed 1 h later and stained with anti-p-H3 Ser10 and DAPI. The numbers of p-H3 Ser10+ cells were scored and normalized to the nonirradiated control. (E) KAP-1 and HDAC1/2 depletion increase the sensitivity of G2/M checkpoint arrest. A549 cells were subjected to KAP-1 siRNA with or without ATMi or HDAC1/2 double siRNA. The percent mitotic cells 2 h after IR were scored. The results represent the means and the SD from three experiments (D and E).
Fig. 4.
Fig. 4.
Depletion of MeCP2 and DNMT3B allows increased γH2AX signal expansion. (A) Depletion of MeCP2 and DNMT3B increases the speed of HC γH2AX focus formation. MeCP2 and DNMT3B siRNA-treated NIH 3T3 cells were irradiated with 1 Gy and fixed at the indicated times. γH2AX focus formation was analyzed as described for Fig. 2. (B) The rate of γH2AX focus formation shown in panel A was normalized to the focus numbers counted at 20 min. The knockdown efficiencies are shown in the right panel. (C) MeCP2 and DNMT3B depletion with siRNA enhances γH2AX signal intensity at the HC regions. NIH 3T3 cells were subjected to siRNA irradiated with 3 Gy, fixed 30 min later, and stained with anti-γH2AX and DAPI. The signal intensity of γH2AX and DAPI per focus was quantified by using ImageJ. The black bars represent the median. The statistical significance was determined by using a Student two-tailed t test. (D and E) Increased γH2AX signal expansion at the HC regions following MeCP2 and DNMT3B siRNA. The regions of γH2AX-chromocenter overlap were analyzed as described for Fig. 2. (F) Depletion of MeCP2 and DNMT3B enhances the γH2AX signal expansion into the HC interior in NIH 3T3 cells. The γH2AX signal expansion within DAPI chromocenters in MeCP2 and DNMT3B siRNA-treated cells was measured as described for Fig. 2. G1 cells negative for p-H3 Ser10 were analyzed (A to F). The results represent the means and the SD from two experiments (A, B, E, and F). n, number of chromocenters analyzed (E and F).
Fig. 5.
Fig. 5.
Rett and ICF syndrome cell lines show a normal rate of DSB repair; MeCP2 and DNMT3B depletion alleviates the DSB repair defect conferred by ATMi treatment. (A) Depletion of MeCP2 and DNMT3B does not influence DSB repair kinetics in 1BR (WT) hTERT cells. To assess the impact of ATM on DSB repair, ATMi was added 30 min prior to IR. A similar result was observed in MeCP2- and DNMT3-depleted NIH 3T3 cells (data not shown). (B) DSB repair was also analyzed by neutral PFGE after 20 Gy of IR. P2 (XLF) hTERT cells show a substantial DSB repair defect, whereas MeCP2-, DNMT3B siRNA-treated 1BR (WT) hTERT cells show normal DSB repair after IR. (C) Rett primary fibroblasts show normal DSB repair in G1 phase, and the hypomorphic MeCP2 mutations in Rett cells do not overcome the DSB repair defect in ATMi-treated cells. (D) Depletion of MeCP2 with siRNA alleviates the DSB repair defect in G1 phase conferred by ATMi treatment in Rett primary fibroblast cells. MeCP2 siRNA was undertaken in control and Rett fibroblasts. (E) Depletion of MeCP2 does not affect DSB repair in G2-phase cells but rescues the repair defect conferred by ATMi addition. 1BR (WT) hTERT cells were subjected to MeCP2 siRNA. G2 cells were identified with CENPF. (F) ICF fibroblast cells show normal DSB repair. Depletion of DNMT3B partly alleviates the DSB repair defect in the presence of ATMi in ICF G1 cells. In panels A and C to F, DSB repair was measured by γH2AX focus analysis after 3 Gy of IR. Aphidicolin (4 μM) was added immediately after IR to prevent S-phase cells progressing into G2 phase and to identify S-phase cells because of extensive γH2AX signaling (A and C to F). Error bars represent the SD from three independent experiments (A to F).
Fig. 6.
Fig. 6.
Rett syndrome cell lines exhibit enhanced ATM signaling after IR. (A) Rett fibroblast cells have normal levels of damage response protein expression. Whole-cell protein extracts were obtained from exponentially growing 48BR (WT) and GM16548, GM11272, and GM11272 (Rett/MeCP2) primary human fibroblast cells. (B) Rett fibroblast cells show normal pATM level without DNA damage. As a positive control, 48BR (WT) cells were irradiated with 0.5 and 3 Gy, and the signals were examined at 30 min after IR. (C) Rett fibroblast G0/G1 cells exhibit increased pATM/pChk2 compared to control fibroblasts. Primary 48BR and Rett cells were synchronized in G0/G1 with contact inhibition for >10 days. G0/G1 arrest was confirmed by fluorescence-activated cell sorting (FACS) (data not shown). (D) Enhanced IR-induced pATM in G1- and G2-phase cycling Rett fibroblast cells compared to control fibroblasts. Cycling 48BR and Rett fibroblast cells were irradiated with the indicated doses. Cells were fixed and stained with pATM, CENPF, and DAPI, 30 min after IR. The signal intensity was analyzed using ImageJ. G2-phase cells were identified by CENP-F. S-phase cells, which show intermediate CENPF levels, were excluded from analysis. Anti-pATM antibody specificity was confirmed as described previously (24). The results represent the means ± the SD from three experiments. (E) The typical images of pATM signal in cycling 48BR and Rett fibroblast cells are shown (40×). (F) Enhanced γH2AX signal in an HC enriched fraction in Rett cells compared to control cells after IR. Lymphoblastoid cell lines (LBLs) were harvested at 30 min after 10 or 20 Gy of IR. To enrich for HC-DNA, the nucleosome fraction was subjected to IP using anti-TriMe K9 histone H3 antibody. (G) Rett LBLs show enhanced global γH2AX signaling after IR. Further, levels of total trimethylated K9 of histone H3 were similar between Rett and control LBLs. (H) ICF fibroblast cells exhibit greater pATM after IR compared to control cells. PT3 (ICF/DNMT3B) cells were arrested in G0/G1 following contact inhibition. More than 90% of the cells were in G1 phase (data not shown). The cells were irradiated with 0.5 Gy, harvested at 1 h after IR, and processed as described above.
Fig. 7.
Fig. 7.
Cell lines from Rett, ICF, and HGPS patients show hypersensitive IR-induced G2/M checkpoint arrest. (A) Rett fibroblast cells exhibit hypersensitive G2/M checkpoint arrest after IR. Two control (48BR and 1BR) and three Rett syndrome (GM16548, GM11271, and GM11272) primary fibroblast lines were analyzed for G2/M checkpoint arrest. (B) Enhanced initiation of checkpoint sensitivity in Rett fibroblast cells is abolished by adding the Chk1/Chk2 inhibitor. The Chk1/Chk2 inhibitor, SB218078, was added 30 min prior to IR. (C) ICF fibroblast cells show hypersensitive G2/M checkpoint arrest. 1BR (WT) and PT3 (ICF/DNMT3) hTERT cells were analyzed for G2/M checkpoint arrest. The inhibitor was added 30 min prior to IR. (D) Depletion of MeCP2 and DNMT3B confers hypersensitive G2/M checkpoint arrest. 1BR (WT) hTERT cells were subjected to MeCP2 and DNMT3B siRNA. Two distinct siRNA oligonucleotides, 1 and 2, were used for each MeCP2 and DNMT3B knockdown. (E) HGPS patient (AG10801) LBLs show hypersensitive G2/M checkpoint arrest. (F) LBLs from patients with HC disorder exhibit prolonged G2/M checkpoint arrest after IR. The maintenance of G2/M checkpoint arrest was examined in control (GM02188), Rett (GM16548), ICF (GM08714), and HGPS (AG10801) LBLs. LBLs were used for this analysis to allow direct comparison between all patient lines, because efficiently growing HGPS cells were only available as LBLs. Consistent with fibroblast cell lines, Rett and ICF patient LBLs showed hypersensitive initial G2/M checkpoint arrest after low-dose IR (data not shown). Aphidicolin (APH) at 4 μM was added immediately after 2 Gy of IR. We have not examined 12-h time point in the inhibitor-treated cells because of cellular toxicity by the drug. The mitotic index was measured using p-H3 Ser10 at 1 h after irradiation (A to E). Error bars represent the SD from three independent experiments (A to F).
Fig. 8.
Fig. 8.
MeCP2 expression restores normal G2/M checkpoint signaling and arrest in MeCP2-defective cells. (A) MeCP2 expression in MeCP2-depleted cells restores normal G2/M checkpoint arrest. siRNA-resistant WT MeCP2 was expressed in 1BR (WT) hTERT cells with or without depletion of endogenous MeCP2 proteins. (B) MeCP2 expression in Rett LBL cells partially rescues the hypersensitive G2/M checkpoint arrest. (C) MeCP2 expression in MeCP2-depleted cells restores the requirement for ATM for DSB repair to MeCP2 siRNA-treated cells. DSB repair in G1 cells was measured by 53BP1 focus analysis after 3 Gy of IR. The mitotic index was measured using p-H3 Ser10 at 1 h after irradiation (A and B). Error bas represent the SD from two or three independent experiments (A to C).

References

    1. Adams J. M., Cory S. 1998. The Bcl-2 protein family: arbiters of cell survival. Science 281:1322–1326 - PubMed
    1. Agarwal N., et al. 2007. MeCP2 interacts with HP1 and modulates its heterochromatin association during myogenic differentiation. Nucleic Acids Res. 35:5402–5408 - PMC - PubMed
    1. Amir R. E., et al. 1999. Rett syndrome is caused by mutations in X-linked MECP2, encoding methyl-CpG-binding protein 2. Nat. Genet. 23:185–188 - PubMed
    1. Anstey A. V., et al. 1999. Characterization of photosensitivity in the Smith-Lemli-Opitz syndrome: a new congenital photosensitivity syndrome. Br. J. Dermatol. 141:406–414 - PubMed
    1. Barber J. B., et al. 2000. Relationship between in vitro chromosomal radiosensitivity of peripheral blood lymphocytes and the expression of normal tissue damage following radiotherapy for breast cancer. Radiother. Oncol. 55:179–186 - PubMed

Publication types

MeSH terms