. 2011;17(11-12):1204-12.
doi: 10.2119/molmed.2011.00063. Epub 2011 Jul 22.

Protective effect of TRPV1 against renal fibrosis via inhibition of TGF-β/Smad signaling in DOCA-salt hypertension

Affiliations

Protective effect of TRPV1 against renal fibrosis via inhibition of TGF-β/Smad signaling in DOCA-salt hypertension

Youping Wang et al. Mol Med. 2011.

Abstract

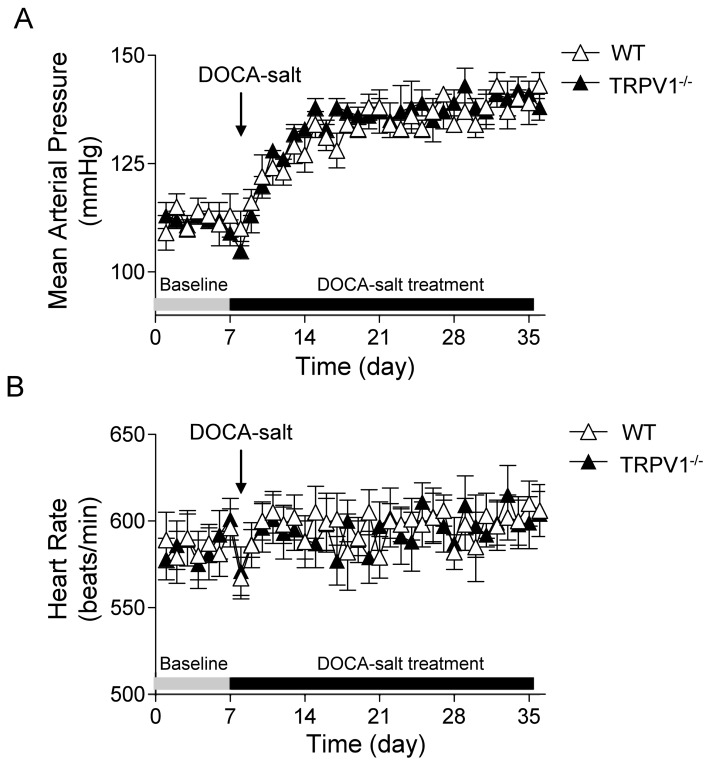
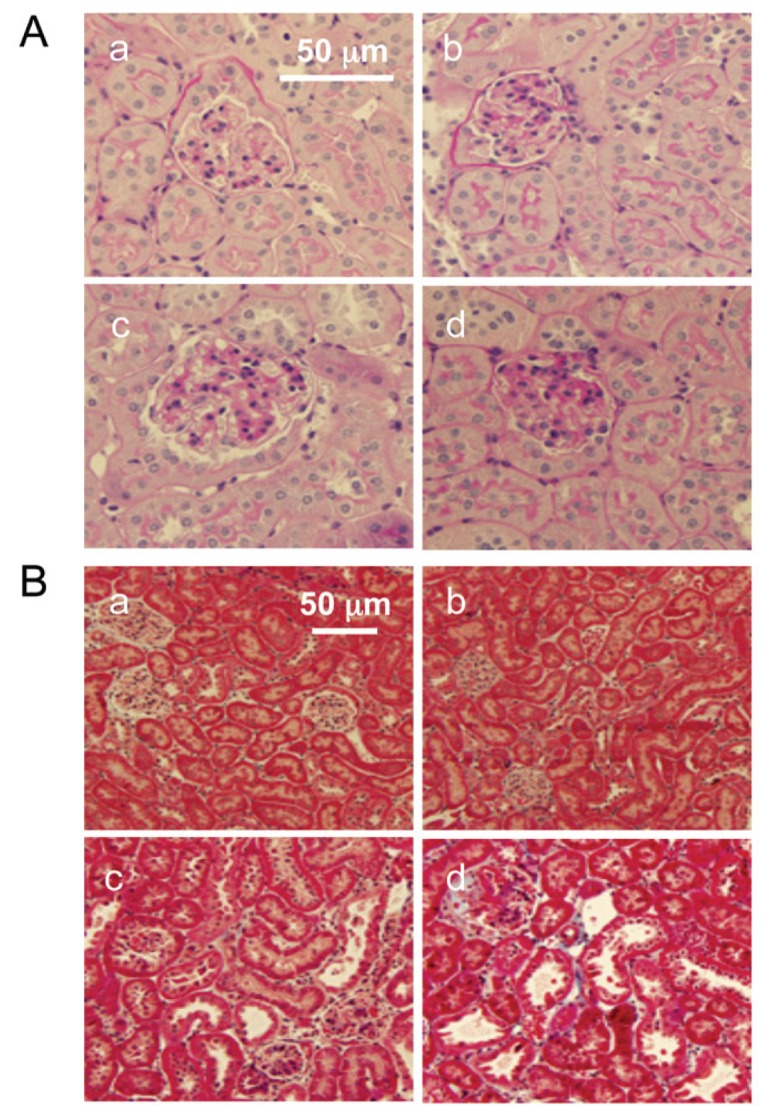
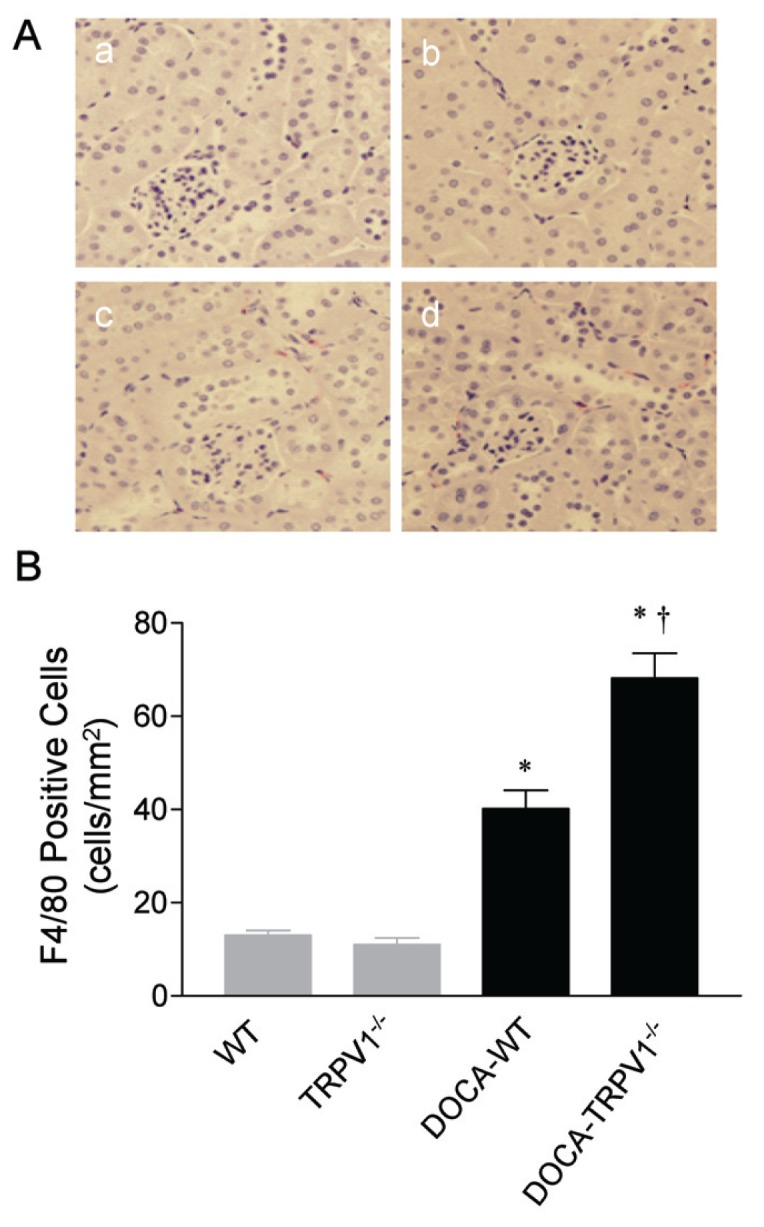
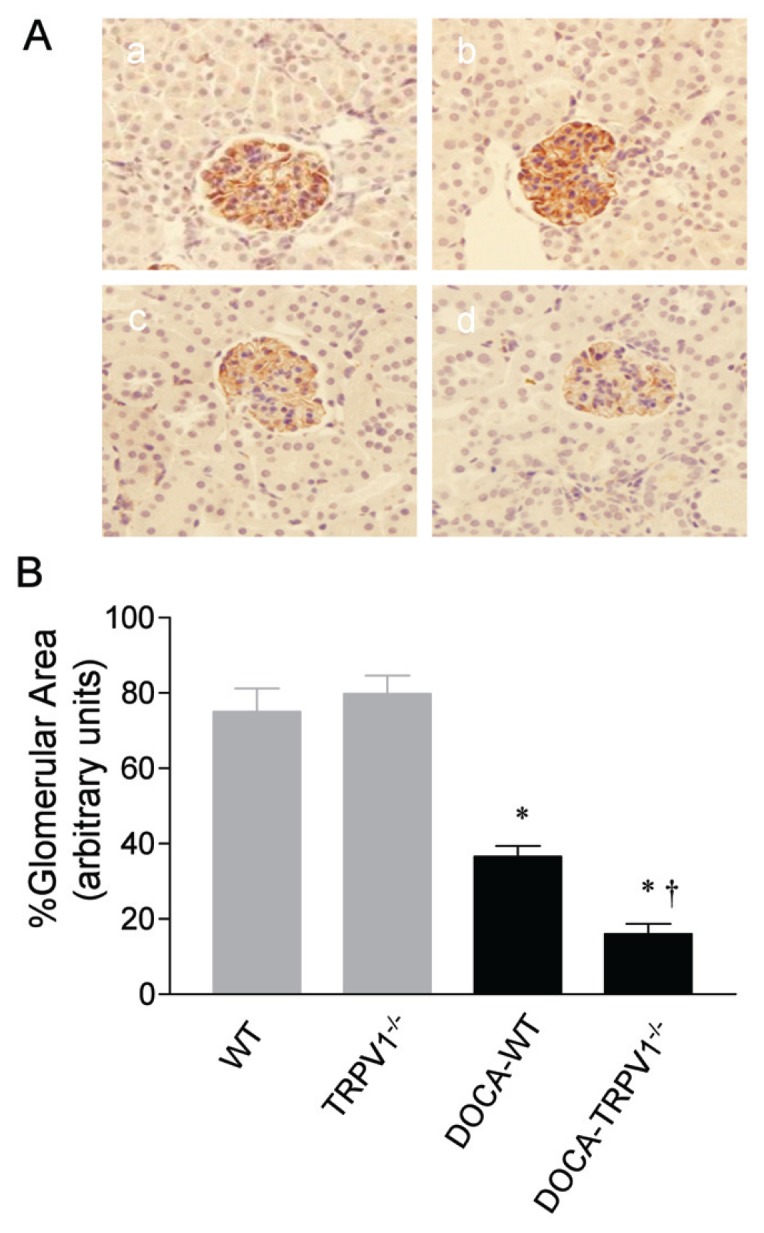
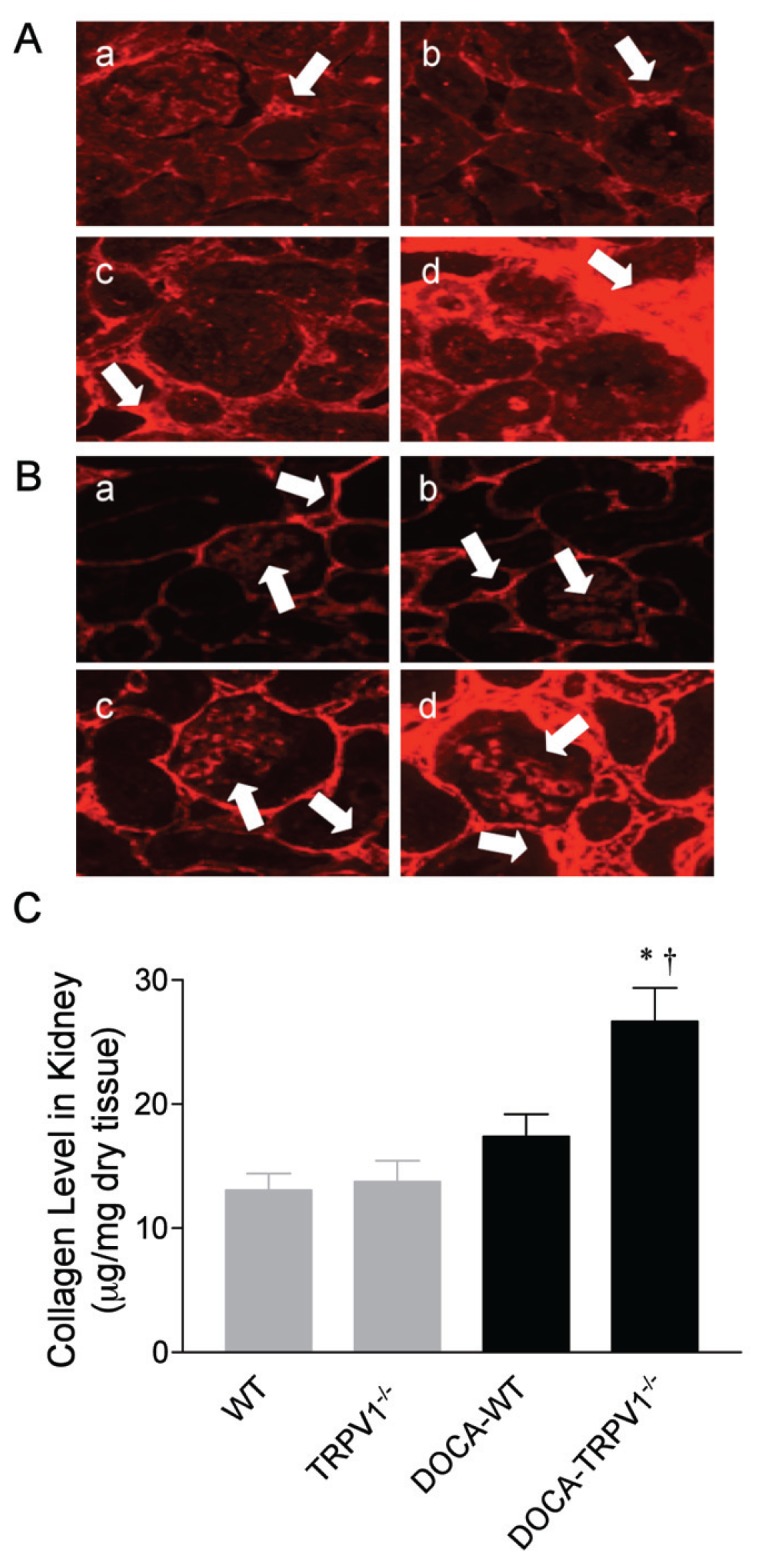
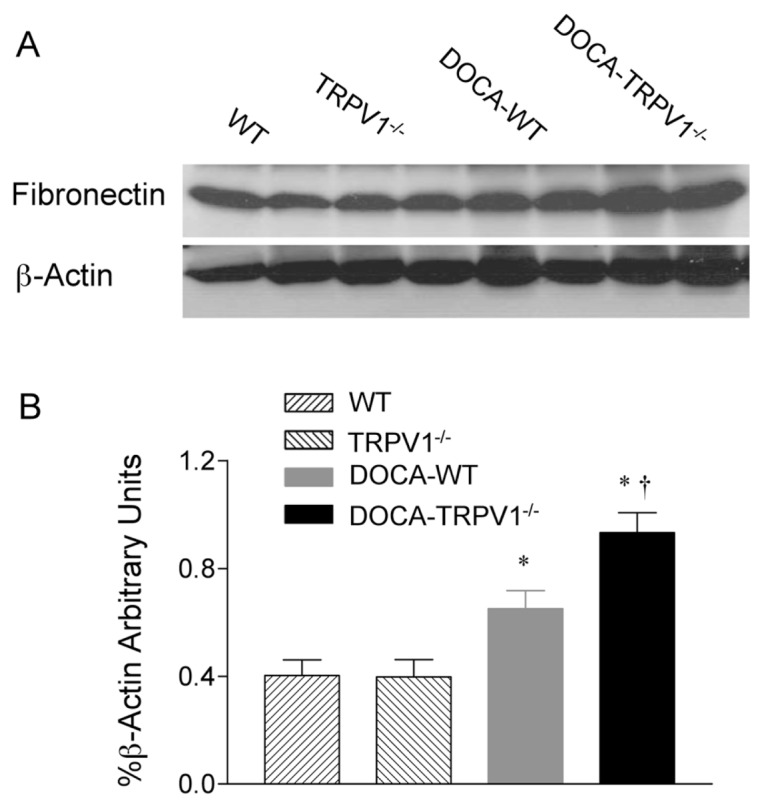
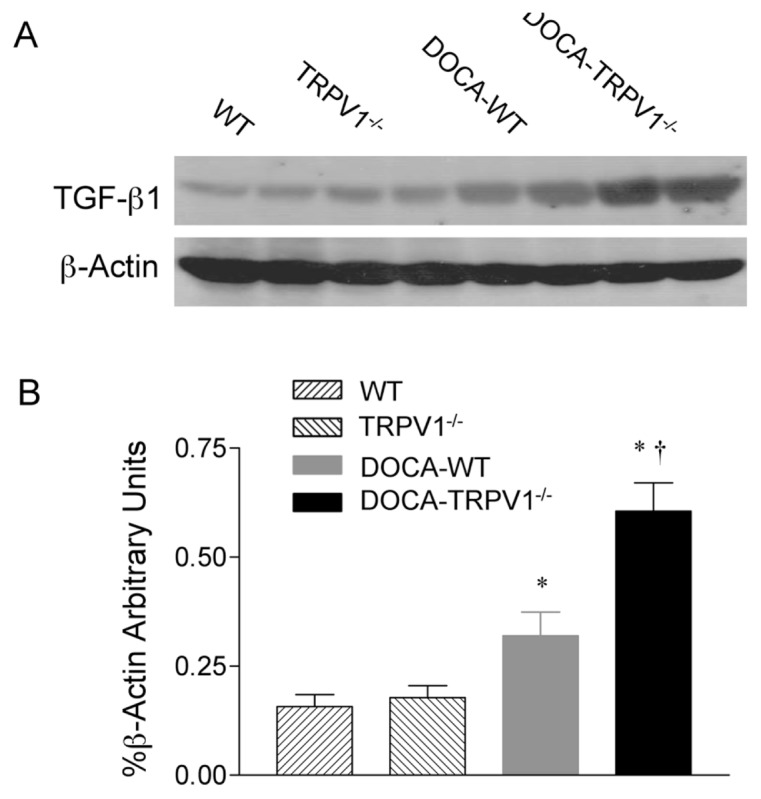
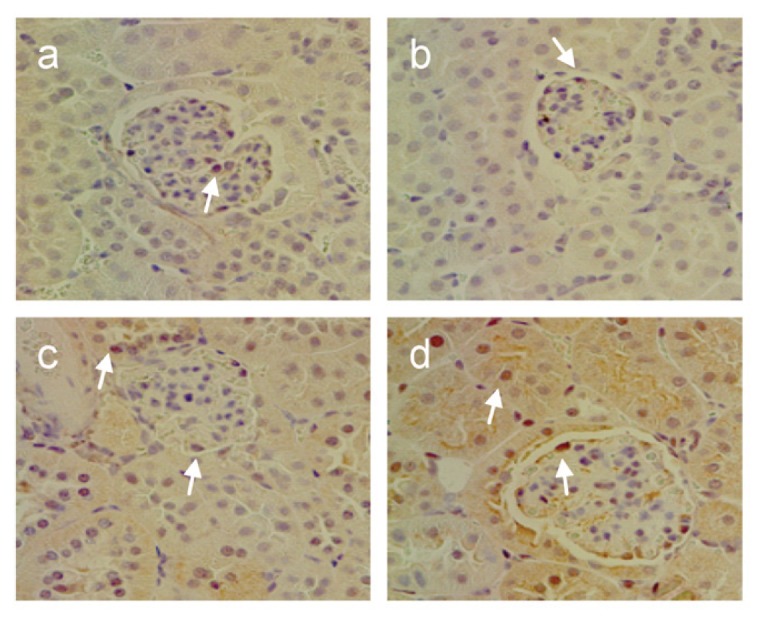
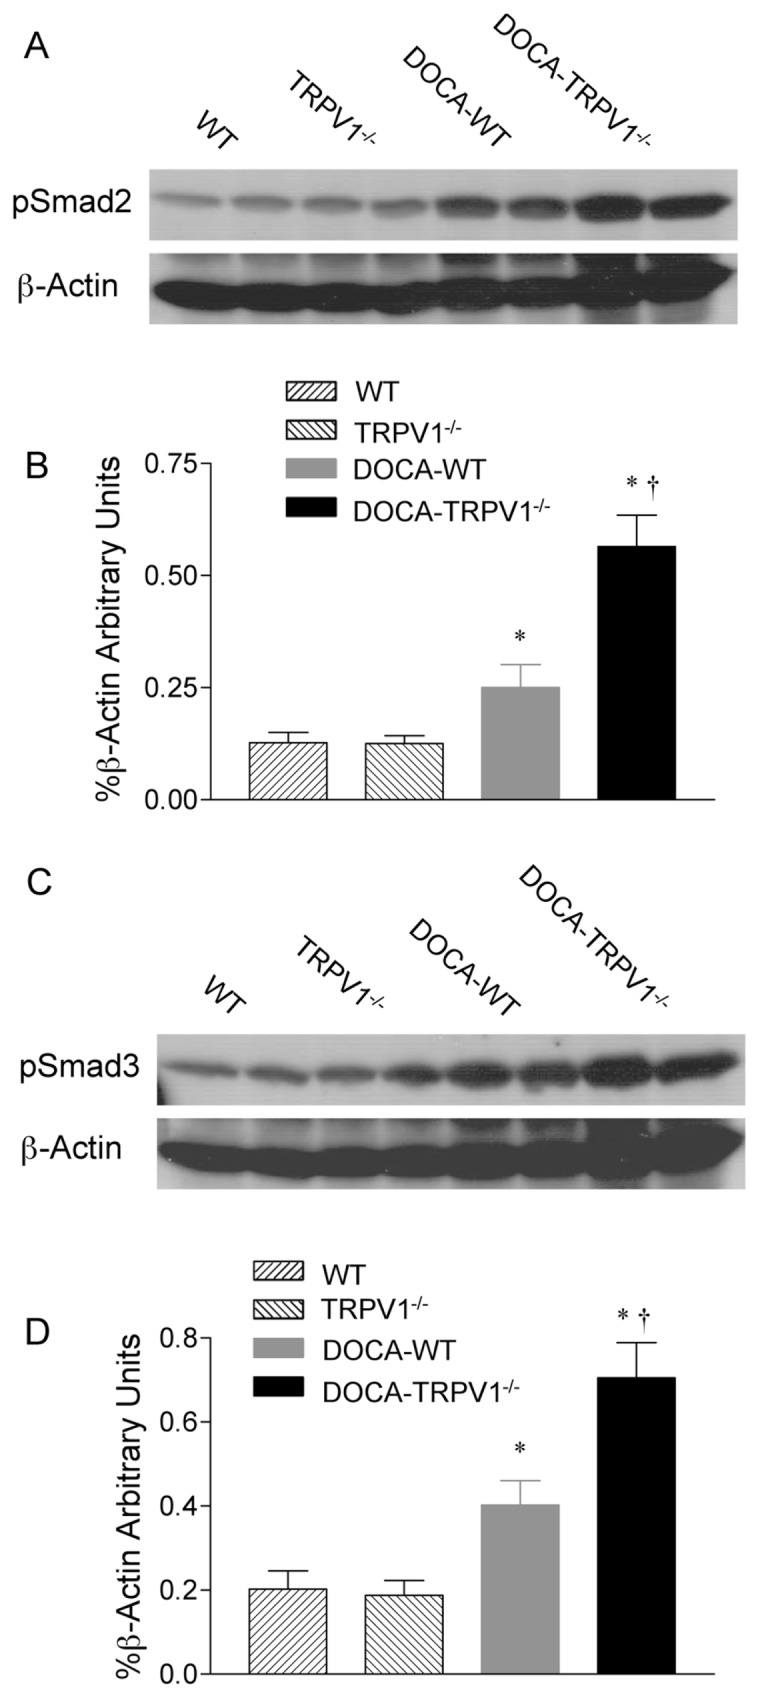
To investigate the effects of the transient receptor potential vanilloid type 1 (TRPV1) channel on renal extracellular matrix (ECM) protein expression including collagen deposition and the transforming growth factor β (TGF-β)/Smad signaling pathway during salt-dependent hypertension, wild-type (WT) and TRPV1-null (TRPV1⁻/⁻) mutant mice were uninephrectomized and given deoxycorticosterone acetate (DOCA)-salt for 4 wks. TRPV1 gene ablation exaggerated DOCA-salt-induced impairment of renal function as evidenced by increased albumin excretion (μg/24 h) compared with WT mice (83.7 ± 7.1 versus 28.3 ± 4.8, P < 0.05), but had no apparent effect on mean arterial pressure (mmHg) as determined by radiotelemetry (141 ± 4 versus 138 ± 3, P > 0.05). Morphological analysis showed that DOCA-salt-induced glomerulosclerosis, tubular injury and macrophage infiltration (cells/mm²) were increased in TRPV1⁻/⁻ compared with WT mice (0.74 ± 0.08 versus 0.34 ± 0.04; 3.14 ± 0.26 versus 2.00 ± 0.31; 68 ± 5 versus 40 ± 4, P < 0.05). Immunostaining studies showed that DOCA-salt treatment decreased nephrin but increased collagen type I and IV as well as phosphorylated Smad2/3 staining in kidneys of TRPV1⁻/⁻ compared with WT mice. Hydroxyproline assay and Western blot showed that DOCA-salt treatment increased collagen content (μg/mg dry tissue) and fibronectin protein expression (%β-actin arbitrary units) in the kidney of TRPV1⁻/⁻ compared with WT mice (26.7 ± 2.7 versus 17.4 ± 1.8; 0.93 ± 0.07 versus 0.65 ± 0.08, P < 0.05). Acceleration of renal ECM protein deposition in DOCA-salt-treated TRPV1⁻/⁻ mice was accompanied by increased TGF-β1, as well as phosphorylation of Smad2/3 protein expression (%β-actin arbitrary units) compared with DOCA-salt-treated WT mice (0.61 ± 0.07 versus 0.32 ± 0.05; 0.57 ± 0.07 versus 0.25 ± 0.05; 0.71 ± 0.08 versus 0.40 ± 0.06, P < 0.05). These results show that exaggerated renal functional and structural injuries are accompanied by increased production of ECM protein and activation of the TGF-β/Smad2/3 signaling pathway. These data suggest that activation of TRPV1 attenuates the progression of renal fibrosis possibly via suppression of the TGF-β and its downstream regulatory signaling pathway.


Figures

Figure 1
Figure 1
Time course responses of mean arterial pressure (A) and heart rate (B) to deoxycorticosterone acetate (DOCA)-salt treatment for 4 wks in WT and TRPV1−/− mice. Mean arterial pressure and heart rate were determined by radiotelemetry and averaged in 24 h. Values are mean ± SE (n = 6).
Figure 2
Figure 2
Changes in renal morphology in WT and TRPV1−/− mice after 4 wks of deoxycorticosterone acetate (DOCA)-salt treatment. Representative PAS-stained (A) or Masson trichrome–stained (B) kidney sections showing glomerulosclerosis or tubulointerstitial injury in control WT and TRPV1−/− mice (a and b), and WT and TRPV1−/− mice (c and d) treated with DOCA-salt. Magnification, 400× (A) or 200× (B).
Figure 3
Figure 3
Changes in renal cortical immunostaining of F4/80-positive cells (monocytes/macrophages) in WT and TRPV1−/− mice after 4 wks of deoxycorticosterone acetate (DOCA)-salt treatment. (A) Representative immunostained kidney sections showing the immunostaining of F4/80-positive cells (monocytes/macrophages in red) in control WT and TRPV1−/− mice (a and b), and WT and TRPV1−/− mice (c and d) treated with DOCA-salt. Magnification, 400×. (B) Bar graph shows the changes in renal cortical F4/80-positive cells (monocytes/macrophages) in WT and TRPV1−/− mice with or without DOCA-salt treatment. Values are mean ± SE (n = 7 to 8). *P < 0.05 compared to control WT or TRPV1−/− mice; P < 0.05 compared to DOCA-WT mice.
Figure 4
Figure 4
Changes in renal glomerular immunostaining of nephrin in WT and TRPV1−/− mice after 4 wks of deoxycorticosterone acetate (DOCA)-salt treatment. (A) Representative immunostained kidney sections showing the immunostaining of nephrin in brown in control WT and TRPV1−/− mice (a and b), and WT and TRPV1−/− mice (c and d) treated with DOCA-salt. Magnification, 400×. (B) Bar graph shows the changes in renal glomerular immunostaining of nephrin in WT and TRPV1−/− mice with or without DOCA-salt treatment. Values are mean ± SE (n = 7 to 8). *P < 0.05 compared to control WT or TRPV1−/− mice; P < 0.05 compared to DOCA-WT mice.
Figure 5
Figure 5
Changes in renal cortical immunolocalization of collagen type I and type IV and collagen levels in WT and TRPV1−/− mice after 4 wks of deoxycorticosterone acetate (DOCA)-salt treatment. (A, B) Representative immunostained kidney sections showing the immunostaining of collagen type I and type IV (in red) in control WT and TRPV1−/− mice (a and b), and WT and TRPV1−/− mice (c and d) treated with DOCA-salt. Arrows point to collagen type I-positive staining (A) or collagen type IV-positive staining (B). Magnification, 400×. (C) Bar graph shows the changes in renal collagen levels in WT and TRPV1−/− mice with or without DOCA-salt treatment. Values are mean ± SE (n = 7 to 8). *P < 0.05 compared to control WT or TRPV1−/− mice; P < 0.05 compared to DOCA-WT mice.
Figure 6
Figure 6
Changes in renal fibronectin protein expression in WT and TRPV1−/− mice after 4 wks of deoxycorticosterone acetate (DOCA)-salt treatment. (A) Representative Western blot of renal fibronectin in WT and TRPV1−/− mice with or without DOCA-salt treatment. (B) Bar graph shows the relative optical density values for renal fibronectin in WT and TRPV1−/− mice with or without DOCA-salt treatment. Results were expressed as ratio of fibronectin to corresponding β-actin. Values are mean ± SE (n = 4 to 5). *P < 0.05 compared to control WT or TRPV1−/− mice; P < 0.05 compared to DOCA-WT mice.
Figure 7
Figure 7
Changes in renal TGF-β1 protein expression in WT and TRPV1−/− mice after 4 wks of deoxycorticosterone acetate (DOCA)-salt treatment. (A) Representative Western blot of renal TGF-β1 in WT and TRPV1−/− mice with or without DOCA-salt treatment. (B) Bar graph shows the relative optical density values for renal TGF-β1 in WT and TRPV1−/− mice with or without DOCA-salt treatment. Results were expressed as ratio of TGF-β1 to corresponding β-actin. Values are mean ± SE (n = 4 to 5). *P < 0.05 compared to control WT or TRPV1−/− mice; P < 0.05 compared to DOCA-WT mice.
Figure 8
Figure 8
Changes in renal cortical immunostaining of phosphorylated Smad2/3-positive cells in WT and TRPV1−/− mice after 4 wks of deoxycorticosterone acetate (DOCA)-salt treatment. Representative immunostained kidney sections showing the immunostaining of phosphorylated Smad2/3 in brown in control WT and TRPV1−/− mice (a and b), and WT and TRPV1−/− mice (c and d) treated with DOCA-salt. Arrows point to phosphorylated Smad2/3-positive cells. Magnification, 400×.
Figure 9
Figure 9
Changes in renal phosphorylated Smad2 (pSmad2) and phosphorylated Smad3 (pSmad3) protein expression in WT and TRPV1−/− mice after 4 wks of deoxycorticosterone acetate (DOCA)-salt treatment. (A, C) Representative Western blot of renal pSmad2 (A) and pSmad3 (C) in WT and TRPV1−/− mice with or without DOCA-salt treatment. (B, D) Bar graphs show the relative optical density values for renal pSmad2 (B) and pSmad3 (D) in WT and TRPV1−/− mice with or without DOCA-salt treatment. Results were expressed as ratio of pSmad2 and pSmad3 to corresponding β-actin. Values are mean ± SE (n = 4 to 5). *P < 0.05 compared to control WT or TRPV1−/− mice; P < 0.05 compared to DOCA-WT mice.

References

    1. Atkins RC. The epidemiology of chronic kidney disease. Kidney Int. 2005;94:S14–18. - PubMed
    1. Hartner A, Veelken R, Wittmann M, Cordasic N, Hilgers KF. Effects of diabetes and hypertension on macrophage infiltration and matrix expansion in the rat kidney. BMC Nephrol. 2005;6:6. - PMC - PubMed
    1. Eddy AA. Molecular basis of renal fibrosis. Pediatr Nephrol. 2000;15:290–301. - PubMed
    1. Mason RM, Wahab NA. Extracellular matrix metabolism in diabetic nephropathy. J Am Soc Nephrol. 2003;14:1358–73. - PubMed
    1. Wang W, Koka V, Lan HY. Transforming growth factor-β and Smad signaling in kidney disease. Nephrology (Carlton) 2005;10:48–56. - PubMed

Publication types

MeSH terms