. 2012 Jun 1;130(11):2728-33.
doi: 10.1002/ijc.26302. Epub 2011 Aug 29.

Nuclear factor kappa B pathway associated biomarkers in AIDS defining malignancies

Affiliations

Nuclear factor kappa B pathway associated biomarkers in AIDS defining malignancies

Juan-Carlos Ramos et al. Int J Cancer. .

Abstract

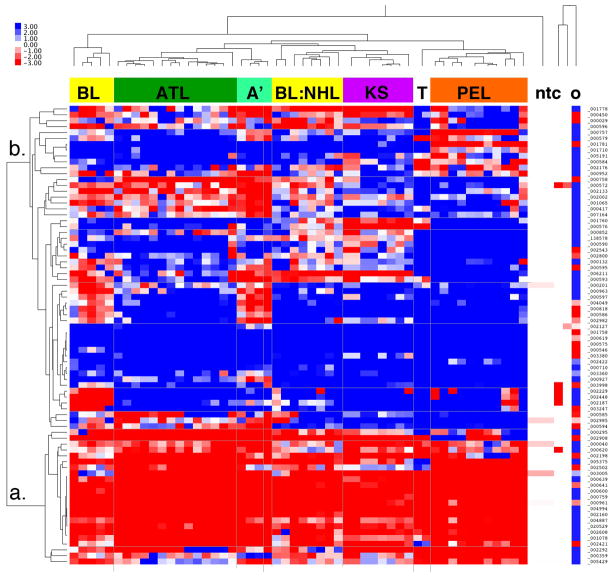
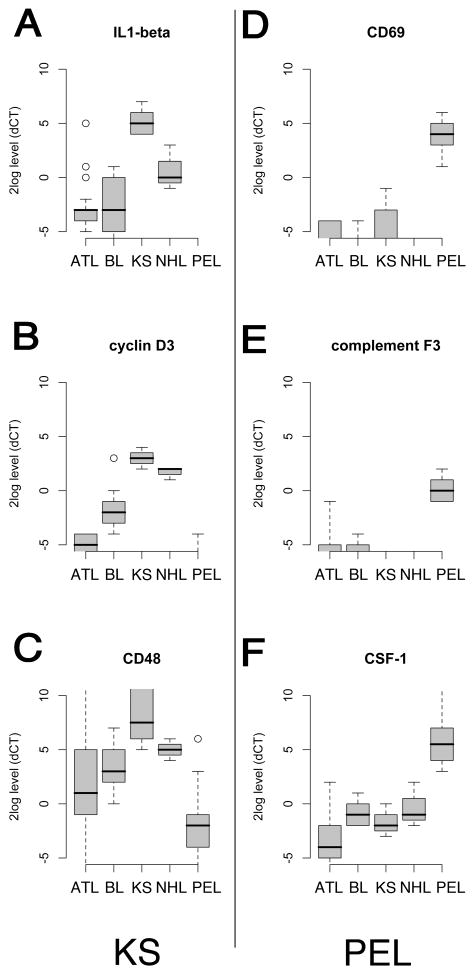
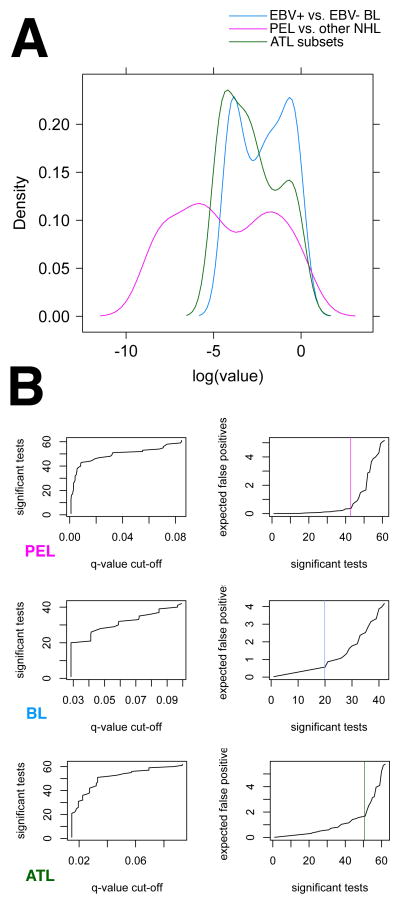
The nuclear factor kappa B (NFκB) pathway is essential for many human cancers. Therapeutics such as bortezomib (Velcade™) that interfere with NFκB signaling are of great clinical interest. NFκB signaling, however, is multifaceted and variable among tissues, developmental and disease entities. Hence, targeted biomarkers of NFκB pathways are of prime importance for clinical research. We developed a novel real-time qPCR-based NFκB array. Only mechanistically validated NFκB targets were included. We then used random-forest classification to define individual genes and gene combinations within the NFκB pathways that define viral lymphoma subclasses as well as Kaposi sarcoma (KS). Few NFκB targets emerged that were universally present in all tumor types tested, underscoring the need for additional tumor-type specific biomarker discovery. (i) We uncovered tissue of origin-specific tumor markers, specifically CD69, CSF-1 and complement factor B (C1QBP) for primary effusion lymphoma (PEL); IL1-beta, cyclinD3 and CD48 for KS. We found that IL12, jun-B, msx-1 and thrombospondin 2 were associated with EBV co-infection in PEL. (ii) We defined the NFκB signature of Epstein-Barr virus (EBV) positive AIDS-associated Burkitt lymphoma (BL). This signature identified CCR5 as the key marker. (iii) This signature differed from EBV negative BL consistent with the idea that EBV not only activates NFκB activity but that this virus also reprograms NFκB signaling toward different targets.


Figures

Figure 1
Figure 1
A. Heatmap representation of unsupervised clustering of all study data. Normalized (dCT) and median-centered relative mRNA levels were clustered by gene and by sample. “Blue” indicates reduction and “Red” indicates induction relative to the median for each sample. “a.” and “b.” indicate the two main clusters of mRNAs. The clusters of samples matched their presumptive origin: BL, Burkitt lymphoma; ATL, Adult T cell leukemia, A’: a novel sub-type of ATL; BL:NHL, a novel subtype of BL, which clustered with non-BL NHL samples; KS, Kaposi sarcomabiopsies, T: KS-like cell lines; PEL, primary effusion lymphoma; ntc, non-template control,; o, outlier ATL sample. Relative scale is indicated on the top left(The data points for the ntc appear white in figure 1A since the normalized data were median-centered by sample).
Figure 2
Figure 2
Supervised class comparison of study data represented as Box plots. The box covers the 25 to 75 percentile of the data, i.e. the inter quartile range (IQR). The horizontal line indicates the median. Whiskers demarcate the minimum and maximum of the data. Open circles denote outliers (1.5 * IQR from the 1st and 3rd quartiles). A, B, C; shown are the top most discriminating mRNAs that distinguish KSHV-associated KS from AIDS-associated lymphoma. D, E, F; shown are the top most discriminating mRNAs that distinguish PEL from AIDS-associated lymphoma and ATL. For these markers p < 0.001 after adjustment for false discovery rate. Relative levels on a log10 scale for the indicated mRNAs are shown on the vertical and classes on the horizontal axis.
Figure 3
Figure 3
Tree-based classification of PEL, BL subsets and ATL subsets. (A) Density plot of p values for each individual mRNA in the array that result from two-sample non-parametric comparison of PEL to all other lymphomas (PEL, purple), the two subsets of BL (BL, blue) and the two subsets of ATL (ATL, green). (B) Corresponding all other NHL diagnostic plots for q-value calculation. For each comparison the left panel plots the number of significant tests, i.e. genes at a given q-value cut-off level. Note that for PEL ~ 40 genes were significant to q≤ 0.02, for BL and ATL subsets only ~ 20. For each comparison the right panel plots the expected number of false positive markers among the top most significant tests on the vertical and the number of significant tests on the horizontal axis. Note that for PEL < 1 false positive is expected within the top 40 most differentially regulated genes, for BL subsets 3–4 false positives are expected and for ATL subsets also < 1.

References

    1. Ghosh S. Handbook of Transcription Factor NF-kappaB. Boca Raton: CRC Press; 2007.
    1. Elkon R, Rashi-Elkeles S, Lerenthal Y, Linhart C, Tenne T, Amariglio N, Rechavi G, Shamir R, Shiloh Y. Dissection of a DNA-damage-induced transcriptional network using a combination of microarrays, RNA interference and computational promoter analysis. Genome Biol. 2005;6:R43. - PMC - PubMed
    1. Keller SA, Schattner EJ, Cesarman E. Inhibition of NF-kappaB induces apoptosis of KSHV-infected primary effusion lymphoma cells. Blood. 2000;96:2537–42. - PubMed
    1. Cahir-McFarland ED, Davidson DM, Schauer SL, Duong J, Kieff E. NF-kappa B inhibition causes spontaneous apoptosis in Epstein-Barr virus-transformed lymphoblastoid cells. Proc Natl Acad Sci U S A. 2000;97:6055–60. - PMC - PubMed
    1. Engels EA, Biggar RJ, Hall HI, Cross H, Crutchfield A, Finch JL, Grigg R, Hylton T, Pawlish KS, McNeel TS, Goedert JJ. Cancer risk in people infected with human immunodeficiency virus in the United States. Int J Cancer. 2008;123:187–94. - PubMed

Publication types

MeSH terms