Review
. 2011 Jul;24(6):569-81.
doi: 10.1002/nbm.1632. Epub 2011 Jan 17.

Hypoxic stress and cancer: imaging the axis of evil in tumor metastasis

Affiliations
Review

Hypoxic stress and cancer: imaging the axis of evil in tumor metastasis

Reut Avni et al. NMR Biomed. 2011 Jul.

Abstract

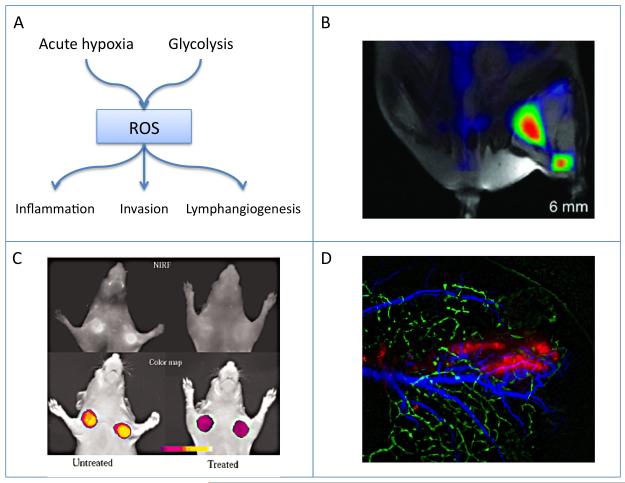
Tumors emerge as a result of the sequential acquisition of genetic, epigenetic and somatic alterations promoting cell proliferation and survival. The maintenance and expansion of tumor cells rely on their ability to adapt to changes in their microenvironment, together with the acquisition of the ability to remodel their surroundings. Tumor cells interact with two types of interconnected microenvironments: the metabolic cell autonomous microenvironment and the nonautonomous cellular-molecular microenvironment comprising interactions between tumor cells and the surrounding stroma. Hypoxia is a central player in cancer progression, affecting not only tumor cell autonomous functions, such as cell division and invasion, resistance to therapy and genetic instability, but also nonautonomous processes, such as angiogenesis, lymphangiogenesis and inflammation, all contributing to metastasis. Closely related microenvironmental stressors affecting cancer progression include, in addition to hypoxia, elevated interstitial pressure and oxidative stress. Noninvasive imaging offers multiple means to monitor the tumor microenvironment and its consequences, and can thus assist in the understanding of the biological basis of hypoxia and microenvironmental stress in cancer progression, and in the development of strategies to monitor therapies targeted at stress-induced tumor progression.


Figures

Figure 1
Figure 1
Blood flow and tumor hypoxia. A) Scheme showing the dynamic interaction of tumor perfusion, cell proliferation and cell death. Oxygen variation between normoxia, and chronic and acute hypoxia affect tumor progression through multiple mechanisms. B) EPR oximetry . Regional tissue pO2 from an SCC tumor-bearing mouse obtained by OMRI at 0.015 mT overlaid on a 7-T MRI. FOV = 32 mm. Reproduced from (27). C) 19F MR oximetry. Partial pressure of oxygen (pO2) maps obtained using FREDOM (fluorocarbon relaxometry using echo planar imaging for dynamic oxygen mapping). Large tumor (3.6 cm3; a-c), and a small tumor (1 cm3; d-f). (a, d) Colorscale of 19F derived hexafluorobenzene distribution. (b, e) pO2 maps during air breathing. (c, f) pO2 maps after 24 min oxygen breathing. Reproduced from (36). D) 1H MR ‘PISTOL’ oximetry, showing pO2 maps of rat thigh muscle (a-e) and Dunning prostate R3327 prostate MAT-Lu tumors (f-j) . (b, g) CHESS spin-echo images showing the distribution of the injected HMDSO. The corresponding time course PISTOL pO2 maps (c, h, air; d, i, 30 min oxygen; e, j, 30 min after return to air). Reproduced from (38).
Figure 2
Figure 2
HIF-1 as a regulator of cellular response to hypoxia A) Scheme showing the hypoxic regulation of hif-1 by hypoxia, and the panel of responses induced by stabilization of hif-1alpha in hypoxic cells. B) BOLD contrast MRI showing response to hyperoxia in Hif-1 alpha deficient ES-teratomas, from (55). C) Hif-1 beta deficient tumors: T2* maps from a WT (a) and a c4 hif-1 beta mutant (b) tumor. Signal intensity, related to hemoglobin oxygenation, demonstrates the heterogeneity within each individual tumor rather than consistent differences between the WT and c4 tumors. Reproduced from (56). D) VHL tumors. BOLD contrast MRI of Hippel-Lindau VHL tumors showing vascular response to hypercapnia and hyperoxia. Halo, treatment with halofuginone as antiangiogenic therapy, reproduced from (57).
Figure 3
Figure 3
Hypoxia, glycolysis, and tumor acidosis. A) Scheme showing the role of hypoxia in mediating tumor glycolytic activity, including increased glucose uptake, lactate production and acidosis. B) Mapping glucose uptake by simultaneous in vivo PET and MR imaging. Mouse FDG tumor imaging: (Upper Left) PET image, (Upper Right) MR image, and (Lower) fused PET and MR image. One transaxial image slice is shown. Reproduced from (65). C) 13C MRI mapping of lactate production from hyperpolarized pyruvate. Color scale maps the intensity of lactate on the anatomical 1H image. The P22 tumor tissue is indicated by the highest signal for lactate. Reproduced from (78). D) 13C MRI pH mapping of a mouse with a subcutaneously implanted EL4 tumour (outlined in white). The pH map was calculated from the ratio of the H13CO3–and 13CO2 in 13C chemical shift images acquired after intravenous injection of hyperpolarized H13CO3. Reproduced from (80).
Figure 4
Figure 4
VEGF as a regulator of hypoxia induced angiogenesis. A) Scheme showing the acute effects of VEGF on vascular permeability. Sustained EGF activation leads to vascular expansion by angiogenesis. Vascular permeability induced by VEGF serves as the driving force for interstitial convection. B-D) Analysis of DCE-MRI using biotin-BSA-GdDTPA of a VEGF over expressing C6 rat glioma tumor in a nude mouse. Reproduced from (91). B) Blood volume fraction (fBV) maps, derived from the initial enhancement, show increased blood vessel in the tumor rim. C) Vessel permeability, permeability surface area product (PSP) map is derived from the initial rate of accumulation of contrast media in the interstitial space. D) Interstitial convection, Time2max map shows the gradual outward flux of contrast media from the tumor rim.
Figure 5
Figure 5
Oxidative stress and metastasis. A) Scheme showing the role of intermittent hypoxia and glycolysis in generation of reactive oxygen species (ROS). Exposure to ROS can induce inflammation, promote tumor cell invasion and stimulate lymphangiogenesis. B) Imaging tumor inflammation, MRI-FMT of tumor associated macrophages. Reproduced from (109). C) Imaging MMP activity. In vivo NIRF imaging of HT1080 tumor-bearing animals. Top row) raw image (700-nm emission). Untreated (left), treated with the MMP inhibitor prinomastat (right). Bottom row) color-coded tumoral maps of MMP-2 activity. Reproduced from (116). D) Intravital imaging of peritumor lymphangiogenesis stimulated by LEDGF-induced expression of VEGF-C. C6 rat glioma tumors (red) were inoculated in the edge of cd-1 nude mouse ear. Lymphatic vessels (green) were detected by fluorescence microlymphangiography. Blood vessels (blue) were detected by dynamic light scattering imaging. Reproduced from (120).

Similar articles

Cited by

References

    1. Hanahan D, Weinberg RA. The hallmarks of cancer. Cell. 2000;100(1):57–70. - PubMed
    1. Warburg O. On respiratory impairment in cancer cells. Science. 1956;124(3215):269–270. - PubMed
    1. Warburg O. On the origin of cancer cells. Science. 1956;123(3191):309–314. - PubMed
    1. Hsu PP, Sabatini DM. Cancer cell metabolism: Warburg and beyond. Cell. 2008;134(5):703–707. - PubMed
    1. Milosevic M, Fyles A, Hedley D, Hill R. The human tumor microenvironment: invasive (needle) measurement of oxygen and interstitial fluid pressure. Semin Radiat Oncol. 2004;14(3):249–258. - PubMed

Publication types