Review
. 2011 Jul;24(6):636-47.
doi: 10.1002/nbm.1664. Epub 2011 Jan 28.

Exploiting the tumor microenvironment for theranostic imaging

Affiliations
Review

Exploiting the tumor microenvironment for theranostic imaging

Ioannis Stasinopoulos et al. NMR Biomed. 2011 Jul.

Abstract

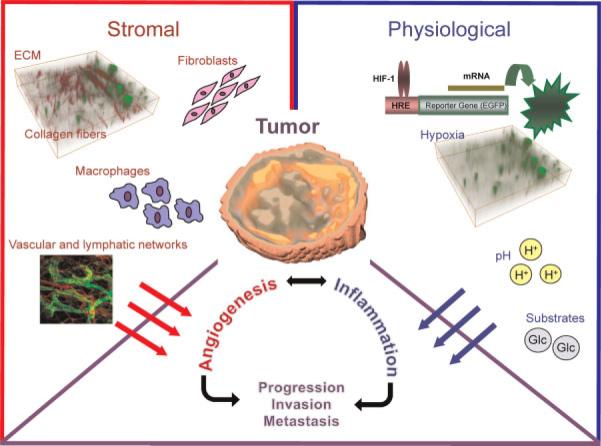
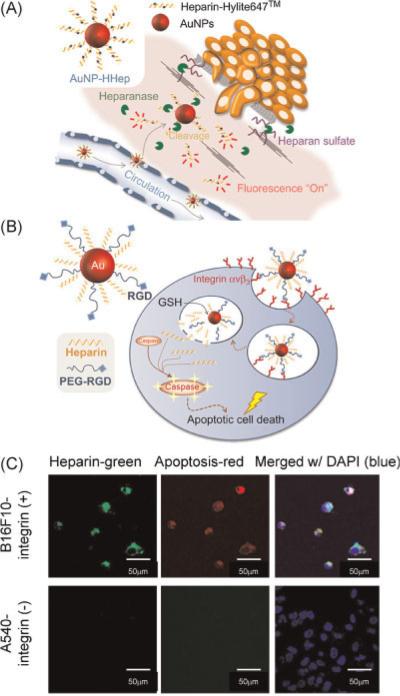
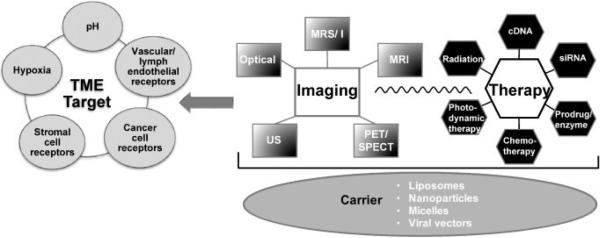
The integration of chemistry and molecular biology with imaging is providing some of the most exciting opportunities in the treatment of cancer. The field of theranostic imaging, where diagnosis is combined with therapy, is particularly suitable for a disease as complex as cancer, especially now that genomic and proteomic profiling can provide an extensive 'fingerprint' of each tumor. Using this information, theranostic agents can be shaped for personalized treatment to target specific compartments, such as the tumor microenvironment (TME), whilst minimizing damage to normal tissue. These theranostic agents can also be used to target multiple pathways or networks by incorporating multiple small interfering RNAs (siRNAs) within a single agent. A decade ago genetic alterations were the primary focus in cancer research. Now it is apparent that the tumor physiological microenvironment, interactions between cancer cells and stromal cells, such as endothelial cells, fibroblasts and macrophages, the extracellular matrix (ECM), and a host of secreted factors and cytokines, influence progression to metastatic disease, aggressiveness and the response of the disease to treatment. In this review, we outline some of the characteristics of the TME, describe the theranostic agents currently available to target the TME and discuss the unique opportunities the TME provides for the design of novel theranostic agents for cancer therapy.


Figures

Figure 1
Figure 1
Schematic diagram to show the different components of the tumor microenvironment. The image of collagen fibers overlaid with hypoxic regions was obtained from an MDA-MB-231 tumor expressing enhanced green fluorescent protein (EGFP) under the control of a hypoxia response element (HRE). Collagen fiber images were acquired with second harmonic generation (SHG) microscopy. The three-dimensional display of the tumor is a parametric image of extracellular transport of a macromolecular contrast agent. The vascular and lymphatic network image is from http://www.imm.ox.ac.uk/wimm-research/mrc-human-immunology-unit/david-jackson/Fig3.jpg/image_preview. ECM, extracellular matrix; HIF-1, hypoxia-inducible factor-1.
Figure 2
Figure 2
Coronal images of a patient with a head and neck squamous cell carcinoma with an overlay of a pretreatment 61Cu(II)-diacetyl-bis(N4-methylthiosemicarbazone) (61Cu-ATSM) positron emission tomography (PET) image. 61Cu-ATSM retention was highest in the planning target volume (PTV) boost, within which the regional node (A) and the regional node and the primary tumor (B) are shown. The regional node contained a more complex distribution of 61Cu-ATSM retention than the primary tumor. The plane in (A) is inferior to the plane in image (B). (C) For intensity-modulated proton therapy-spot scanning (IMPT-SS), the entire region that is prescribed a nonuniform, nonzero dose (a) is covered with proton beam spots (an example beam spot is shown) shown as yellow dots (b). For intensity-modulated proton therapy-distal gradient tracking (IMPT-DGT), the dose prescription is thresholded to two uniform levels (c), and spots are then placed only at the locations of dose gradients (d). Reprinted with permission from ref. (22).
Figure 3
Figure 3
(A) Schematic illustration of heparin-immobilized gold nanoparticles (AuNP-HHep) for metastatic cancer cell detection. (B) Schematic illustration of targeted apoptotic cancer cell death for αvβ3-integrin-positive cells on treatment with heparin and polyethylene glycol-arginine–glycine–aspartic acid (PEG-RGD)-immobilized gold nano-particles (AuNP-Hep/PEG-RGD). (C) Confocal microscopic images of B16F10 cells (αvβ3-integrin positive) and A549 cells (αvβ3-integrin negative) following incubation with AuNP Hep/PEG-RGD. Heparin was fluorescently labeled with fluorescein (green), and apoptosis-related caspases 3 and 7 were detected by magic red assay (red). Cell nuclei were stained with 4′,6-diamidino-2-phenylindole (DAPI) (blue). Reprinted with permission from ref. (82).
Figure 4
Figure 4
(A) Tumor neovascular morphology revealed by three-dimensional reconstructions of MR signal enhancement. The tumor volume is outlined in gray, and voxels meeting the enhancement threshold at 2 h post-injection of contrast agent are shown in blue. Left: two rotated views of an α5β1(arginine–glycine–aspartic acid, RGD)-targeted tumor. The cross-sections on the right demonstrate the paucity of angiogenesis in the core. Right: minimal enhancement associated with irrelevant arginine–glycine–serine (RGS)-targeted contrast agent. (B) Assessment of the anti-angiogenic response to integrin-targeted fumagillin nanoparticles (NPs) with α5β1vβ3)-targeted MR contrast agent. Top: the extent of neovascularity was quantified by calculating the amount of signal enhancement in the tumor periphery. α5β1vβ3)-targeted fumagillin NPs reduced peripheral tumor neovascularity relative to control (p < 0.05, n ¼ 5). αvβ3-targeted fumagillin NPs had no significant effect on angiogenesis, compared with control. Bottom: the effect of α5β1vβ3)-targeted fumagillin NPs on tumor neovascular morphology is clearly apparent on three-dimensional reconstructions of MR signal enhancement. Tumor volume is outlined in gray; contrast-enhanced pixels are in blue. Reprinted with permission from ref. (95).
Figure 5
Figure 5
Schematic diagram of strategies for theranostic agents. The figure outlines the imaging modalities, therapy and potential tumor microenvironment (TME) targets that can be used for the development of such agents. PET, positron emission spectrometry; siRNA, small interfering RNA; SPECT, single photon emission computed tomography; US, ultrasound.

References

    1. Hanahan D, Weinberg RA. The hallmarks of cancer. Cell. 2000;100:57–70. - PubMed
    1. Kenny PA, Lee GY, Bissell MJ. Targeting the tumor microenvironment. Front. Biosci. 2007;12:3468–3474. - PMC - PubMed
    1. Vaupel P, Kallinowski F, Okunieff P. Blood flow, oxygen and nutrient supply, and metabolic microenvironment of human tumors: a review. Cancer Res. 1989;49:6449–6465. - PubMed
    1. Bertout JA, Patel SA, Simon MC. The impact of O2 availability on human cancer. Nat. Rev. Cancer. 2008;8:967–975. - PMC - PubMed
    1. Dewhirst MW, Cao Y, Moeller B. Cycling hypoxia and free radicals regulate angiogenesis and radiotherapy response. Nat. Rev. Cancer. 2008;8:425–437. - PMC - PubMed

Publication types