. 2011 Oct;11(10):2110-22.
doi: 10.1111/j.1600-6143.2011.03666.x. Epub 2011 Jul 27.

MicroRNA profiles in allograft tissues and paired urines associate with chronic allograft dysfunction with IF/TA

Affiliations

MicroRNA profiles in allograft tissues and paired urines associate with chronic allograft dysfunction with IF/TA

M J Scian et al. Am J Transplant. 2011 Oct.

Abstract

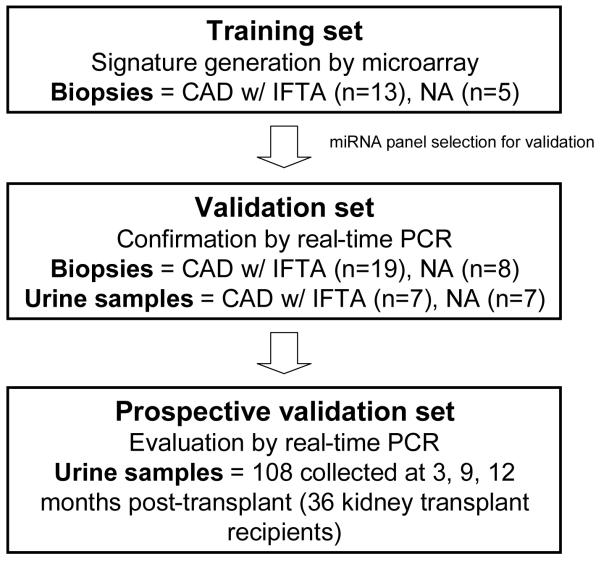
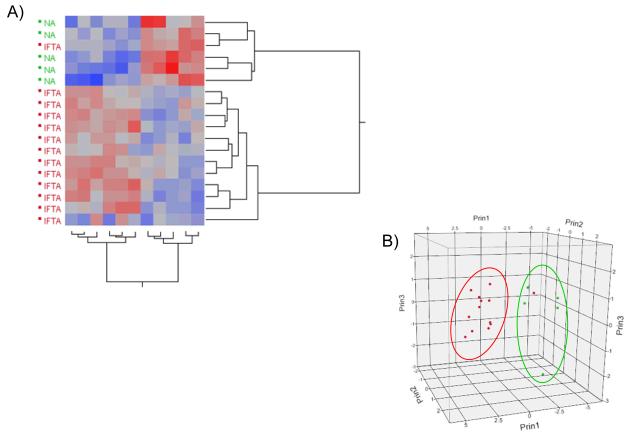
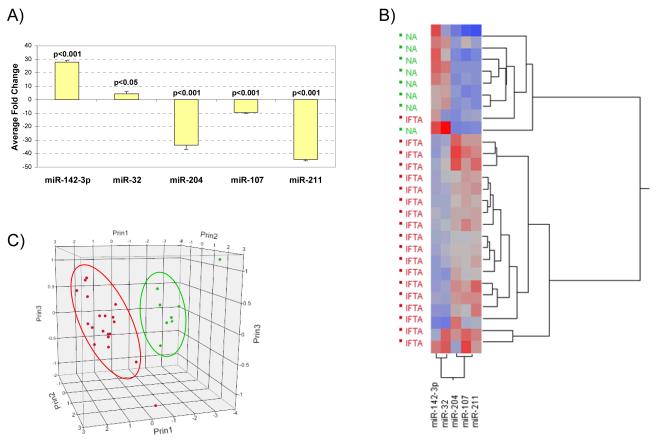
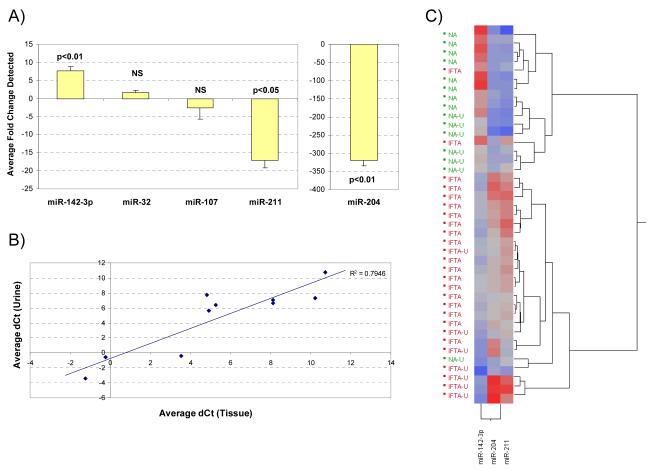
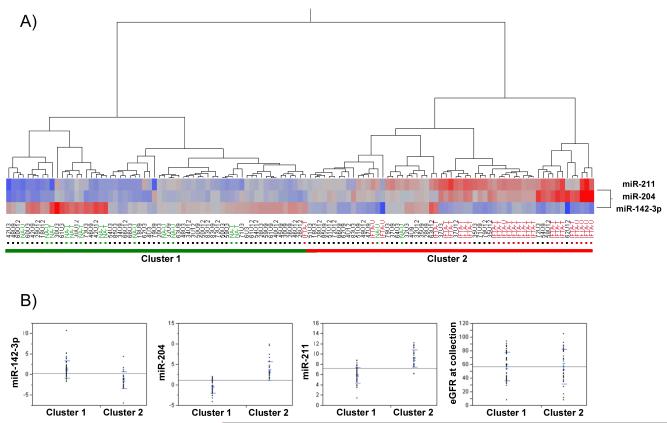
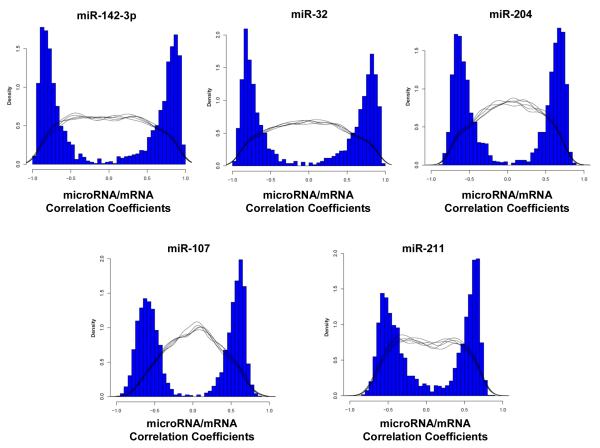
Despite the advances in immunosuppression, renal allograft attrition over time remains unabated due to chronic allograft dysfunction (CAD) with interstitial fibrosis (IF) and tubular atrophy (TA). We aimed to evaluate microRNA (miRNA) signatures in CAD with IF/TA and appraise correlation with paired urine samples and potential utility in prospective evaluation of graft function. MiRNA signatures were established between CAD with IF/TA versus normal allografts by microarray. Validation of the microarray results and prospective evaluation of urine samples was performed using real-time quantitative-PCR (RT-qPCR). Fifty-six miRNAs were identified in samples with CAD-IF/TA. Five miRNAs were selected for further validation based on array fold change, p-value and in silico predicted mRNA targets. We confirmed the differential expression of these five miRNAs by RT-qPCR using an independent set of samples. Differential expression was detected for miR-142-3p, miR-204, miR-107 and miR-211 (p < 0.001) and miR-32 (p < 0.05). Furthermore, differential expression of miR-142-3p (p < 0.01), miR-204 (p < 0.01) and miR-211 (p < 0.05) was also observed between patient groups in urine samples. A characteristic miRNA signature for IF/TA that correlates with paired urine samples was identified. These results support the potential use of miRNAs as noninvasive markers of IF/TA and for monitoring graft function.


Figures

Figure 1
Figure 1
Study design. Training set: For creating a signature of differentially expressed miRNAs, allograft tissue samples with histological diagnosis of CAD with IF/TA were evaluated using microarrays. Normal allograft (NA) samples (defined as samples obtained from kidney transplant recipients with at least 9 months post-transplantation, normal histology and continue eGFR >60 mL/min/1.73 m20 were used as control group. Validation set: The selected miRNAs for validation (using in silico target prediction and consecutive filtering of the results using our pre-established CAD with IF/TA gene expression signature) were validated in an independent set of patients (CAD with IF/TA and NA) using unique and paired biopsy and urine samples and using a second method (QPCR). Prospective validation set: The miRNAs identified as having correlation between tissue and urine expression were validated in an independent set of urine samples (collected at 3, 9, and 12 months post-transplantation) from 36 kidney transplant recipients.
Figure 2
Figure 2
(A) Graphical representation using supervised hierarchical clustering of the reduced set for the differentially expressed miRNAs using Ward’s method. Higher intensity values are colored in red; lower values in blue. (B) Principal component analysis for the miRNA BeadChip® Array data for the 15 miRNAs of interest. NA samples are colored in green; IF/TA samples in red.
Figure 3
Figure 3
(A) Taqman® MicroRNA Assays RT-qPCR results using tissue samples with histology confirmed IF/TA for 5 of the miRNAs identified in the Illumina Array study. The fold change was calculated using the ΔΔCt method. RNU48 was used as the normalizing endogenous control. (B) Unsupervised hierarchical clustering of all RT-qPCR ΔCt values using Ward’s method. Higher ΔCt values are colored red; lower values are blue. (C) Principal component analysis using the RT-qPCR ΔCt data. NA samples are colored in green; IF/TA samples in red.
Figure 4
Figure 4
(A) Taqman® MicroRNA Assays RT-qPCR results using urine samples collected from patients with confirmed IF/TA. The fold change was calculated using the ΔΔCt method. RNU48 was used as the endogenous control. (B) Scatterplot comparing average ΔCt values obtained for NA and IFTA tissue and urine samples for the 5 miRNAs of interest. (C) Unsupervised hierarchical clustering of all RT-qPCR ΔCt values for miR-142-3p, miR-204 and miR-211 using Ward’s method for all tissue and urine samples; urine samples have been designated with the letter U. Higher ΔCt values are colored red; lower values are blue.
Figure 5
Figure 5
(A) Hierarchical clustering of RT-qPCR ΔCt values for miR-142-3p, miR-204 and miR-211 using Ward’s method for all urine samples evaluated prospectively. NA and IF/TA tissue (T) and urine (U) samples used in the signature confirmation have been colored in green (NA) and red (IF/TA) for reference; higher ΔCt values are colored red; lower values are blue. (B) Comparison of ΔCt values for miR-142-3p, miR-204, miR-211 and eGFR values for samples in clusters 1 and 2 from (A).
Figure 6
Figure 6
Distribution of the miRNA/mRNA Pearson correlation values for the five miRNAs confirmed by RT-qPCR. Only Pearson coefficients with associated significant empirical p-values were graphed. The black lines represent five representative repetitions of the null distribution obtained when expression for each of the five miRNAs was compared to randomly selected mRNA expression data.

References

    1. Racusen LC, Solez K, Colvin RB, Bonsib SM, Castro MC, Cavallo T, et al. The Banff 97 working classification of renal allograft pathology. Kidney Int. 1999;55(2):713–723. - PubMed
    1. Solez K, Colvin RB, Racusen LC, Haas M, Sis B, Mengel M, et al. Banff 07 classification of renal allograft pathology: updates and future directions. Am.J.Transplant. 2008;8(4):753–760. - PubMed
    1. Schold JD, Kaplan B. The elephant in the room: failings of current clinical endpoints in kidney transplantation. Am.J.Transplant. 2010;10(5):1163–1166. - PubMed
    1. Poggio ED, Batty DS, Flechner SM. Evaluation of renal function in transplantation. Transplantation. 2007;84(2):131–136. - PubMed
    1. Manotham K, Booranalertpaisarn V, Eiam-Ong S, Chusil S, Praditpornsilpa K, Tungsanga K. Accurately simple estimation of glomerular filtration rate in kidney transplant patients. Transplant.Proc. 2002;34(4):1148–1151. - PubMed

Publication types