Review
. 2011 Aug;5(4):336-48.
doi: 10.1016/j.molonc.2011.06.004. Epub 2011 Jul 7.

Transcriptional modulation induced by ionizing radiation: p53 remains a central player

Affiliations
Review

Transcriptional modulation induced by ionizing radiation: p53 remains a central player

Sharon Rashi-Elkeles et al. Mol Oncol. 2011 Aug.

Abstract

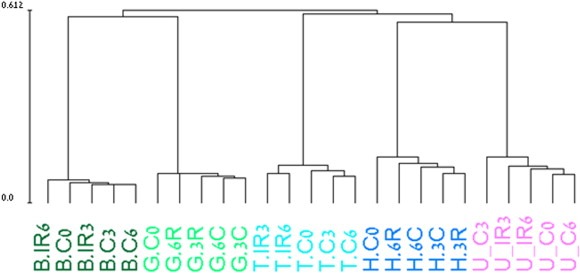
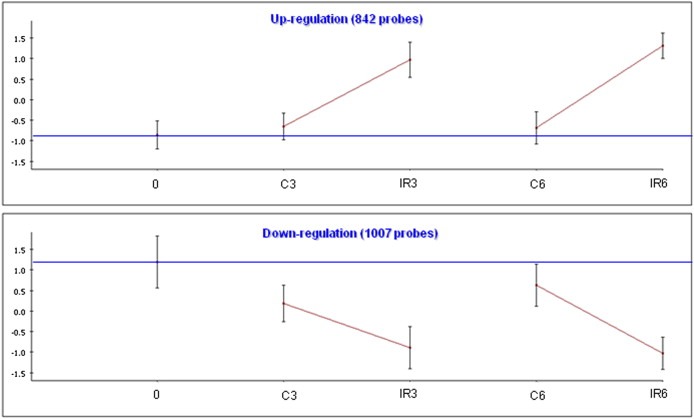
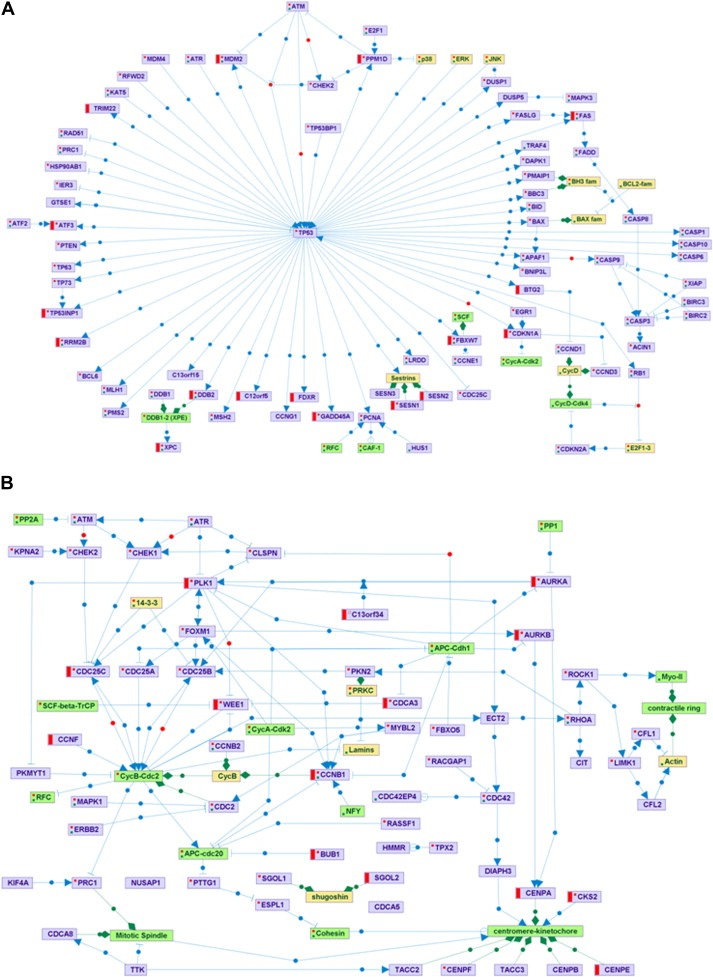
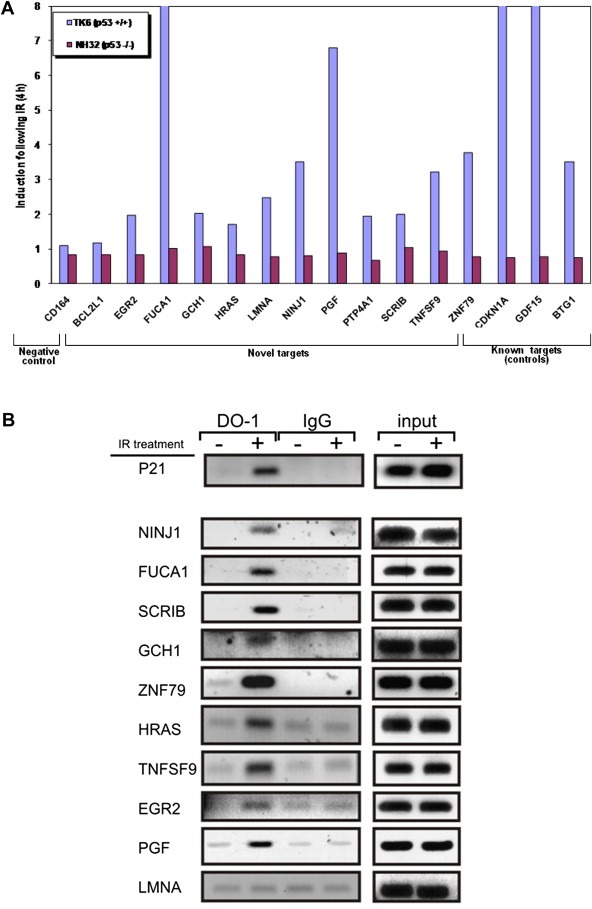
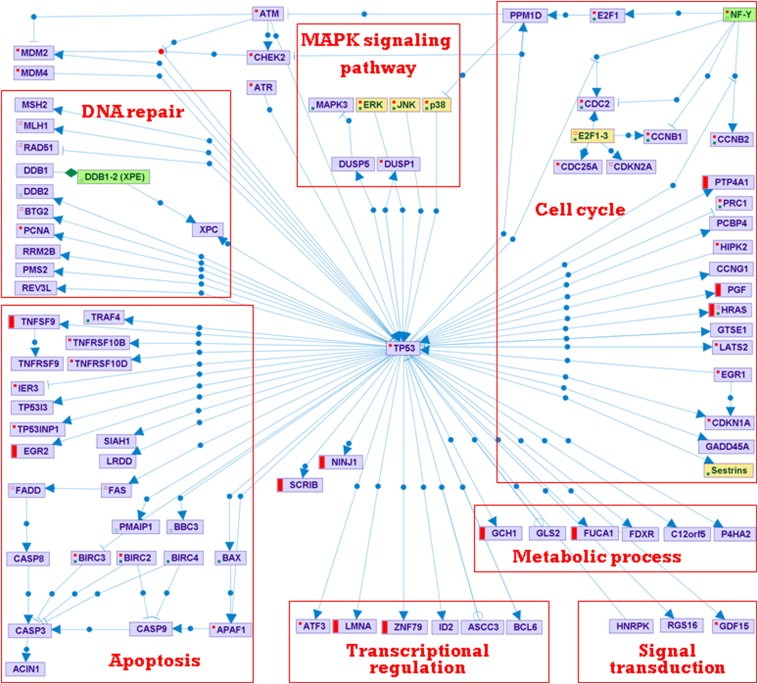
The cellular response to DNA damage is vital for maintaining genomic stability and preventing undue cell death or cancer formation. The DNA damage response (DDR), most robustly mobilized by double-strand breaks (DSBs), rapidly activates an extensive signaling network that affects numerous cellular systems, leading to cell survival or programmed cell death. A major component of the DDR is the widespread modulation of gene expression. We analyzed together six datasets that probed transcriptional responses to ionizing radiation (IR) - our novel experimental data and 5 published datasets - to elucidate the scope of this response and identify its gene targets. According to the mRNA expression profiles we recorded from 5 cancerous and non-cancerous human cell lines after exposure to 5 Gy of IR, most of the responses were cell line-specific. Computational analysis identified significant enrichment for p53 target genes and cell cycle-related pathways among groups of up-regulated and down-regulated genes, respectively. Computational promoter analysis of the six datasets disclosed that a statistically significant number of the induced genes contained p53 binding site signatures. p53-mediated regulation had previously been documented for subsets of these gene groups, making our lists a source of novel potential p53 targets. Real-time qPCR and chromatin immunoprecipitation (ChIP) assays validated the IR-induced p53-dependent induction and p53 binding to the respective promoters of 11 selected genes. Our results demonstrate the power of a combined computational and experimental approach to identify new transcriptional targets in the DNA damage response network.


Figures

Figure 1
Figure 1
Hierarchical clustering of the conditions in our dataset. Samples were ordered in a hierarchical tree (dendrogram) according to similarity in their expression profiles: samples with similar profiles are connected by a short tree edges while samples with very different expression profiles have longer tree distance. The main divider of the samples in the dendrogram is cell line, demonstrating that cell type rather than irradiation is the major determinant of expression profile in our dataset. The name of each condition (shown below its location along the dendrogram) contains the initial of the corresponding cell line (B = Bj‐1; G = G361; T = TK6; H = HepG2 and U = U2OS); C stands for control and IR represents the irradiated sample. The scale at the side of the dendrogram indicates the relative distance between the different conditions.
Figure 2
Figure 2
IR‐responsive gene clusters in TK6 cells. We used the clustering algorithm CLICK to divide the set of responding genes in each cell line into clusters, each of which represents a set of genes with similar expression patterns. The total number of genes in each cluster is indicated. For each cluster, the graph shows the mean expression pattern of all its genes. Error bars represent one S.D. Prior to clustering, gene expression levels were standardized to mean = 0 and SD = 1; the y‐axis corresponds to the standardized levels. The horizontal blue line represents the expression level in the untreated t0 sample (‘basal expression level’). The x‐axis corresponds to the examined conditions: C: untreated control. IR: irradiated cells. Post‐irradiation time points are indicated (0, 3 or 6 h).
Figure 3
Figure 3
Core response to IR depicted using the SPIKE knowledge base of signaling pathways (Paz et al., 2011). Violet nodes are proteins, green nodes are protein complexes, and yellow nodes are protein families. Blue edges represent regulations: arrows correspond to activation; T‐shaped edges to inhibition, and open circles denote regulations whose effect is still not clear. Green edges represent association between nodes (e.g., association between a protein complex and its components). Red and green dots within a node indicate that not all the regulations and associations stored in SPIKE database for the node are displayed in the map. A. The core set of IR‐induced genes is significantly enriched for genes in the p53‐regulated network. Red bars denote genes that were induced in at least 3 of the 5 cell lines. B. The core set of IR‐repressed genes is significantly enriched for genes involved in the G2/M transition in the cell cycle. Red bars denote genes that were repressed in at least in 3 of the 5 cell lines.
Figure 4
Figure 4
A. Validation of selected p53 novel targets using real‐time qPCR. The figure represents the fold‐induction of various genes 4 h after irradiation with 5 Gy. Blue bars: p53‐proficient TK6 cells; Red bars: p53‐deficient NH32 cells. The fold of induction represented is averaged over three independent measurements. B. Binding of p53 to selected novel p53 target promoters demonstrated using a ChIP assay. TK6 cells were harvested prior to and 1.5 h after irradiation with 10 Gy of IR, and ChIP was carried out as described in the supplementary methods section using a monoclonal antibody (DO‐1) against human p53. PCR was performed using the immune complexes as templates and 13 pairs of primers designed to identify p53 binding sites within the promoters of 12 selected genes (sequences are available in Supplementary Table D). GAPDH served as negative control. Input samples corresponding to eluted DNA before immunoprecipitation, as well as IgG‐immmunoprecipitated chromatin served as positive and negative controls, respectively, for the ChIP assay.
Figure 5
Figure 5
Integration of novel p53 targets in the IR‐induced, p53‐regulated network. The map was created using the SPIKE tool. New p53 targets are marked with red bars. Violet nodes are proteins, green nodes are protein complexes, and yellow nodes are protein families. Blue edges represent regulations: arrows correspond to activation; T‐shaped edges to inhibition, and open circles denote regulations whose effect is still not clear. Green edges represent association between nodes (e.g., association between a protein complex and its components). Red and green dots within a node indicate that not all the regulations and associations stored in SPIKE database for the node are displayed in the map.

References

    1. Adachi, N. , Nomoto, M. , 2000. Cell-cycle regulation of the DNA topoisomerase IIalpha promoter is mediated by proximal CCAAT boxes: possible involvement of acetylation. Gene. 245, (1) 49–57. - PubMed
    1. Akerman, G.S. , Rosenzweig, B.A. , 2005. "Alterations in gene expression profiles and the DNA-damage response in ionizing radiation-exposed TK6 cells.". Environ. Mol. Mutagen.. 45, (2–3) 188–205. - PubMed
    1. Al-Hakim, A. , Escribano-Diaz, C. , 2010. The ubiquitous role of ubiquitin in the DNA damage response. DNA Repair (Amst). 9, (12) 1229–1240. - PMC - PubMed
    1. Alderson, M.R. , Smith, C.A. , 1994. Molecular and biological characterization of human 4-1BB and its ligand. Eur. J. Immunol.. 24, (9) 2219–2227. - PubMed
    1. Amundson, S.A. , Bittner, M. , 1999. Fluorescent cDNA microarray hybridization reveals complexity and heterogeneity of cellular genotoxic stress responses. Oncogene. 18, (24) 3666–3672. - PubMed

Publication types

MeSH terms

Substances