. 2011 Oct;85(19):10425-30.
doi: 10.1128/JVI.05293-11. Epub 2011 Jul 27.

Epstein-Barr virus nuclear antigen 1 replication and segregation functions in nasopharyngeal carcinoma cell lines

Affiliations

Epstein-Barr virus nuclear antigen 1 replication and segregation functions in nasopharyngeal carcinoma cell lines

Nirojini Sivachandran et al. J Virol. 2011 Oct.

Abstract

Nasopharyngeal carcinomas (NPC) are usually Epstein-Barr virus (EBV) positive, but, with the exception of C666-1 cells, these cells lose the EBV genomes when grown in culture. Maintenance of EBV requires the viral EBV nuclear antigen 1 (EBNA1) protein, which ensures the replication and mitotic segregation of the genomes through interactions with OriP. Here we compare the abilities of C666-1 and NPC cells that have lost EBV genomes to replicate and segregate OriP plasmids. We found that either cell line can replicate and maintain OriP plasmids for extended periods under conditions where low levels of EBNA1 are expressed but that high EBNA1 levels selectively interfered with mitotic segregation.


Figures

Fig. 1.
Fig. 1.
Comparison of maintenance of OriP plasmids in multiple cell lines. (A) Schematic representation of the OriP and OriPE plasmids used in this study. The DS element and FR of OriP are indicated by the dark boxes. OripE,GA is the same as OriPE except that the EBNA1 cDNA is 670 bp larger. hCMV, human CMV. (B) The abilities of CNE2 and HeLa cells to replicate and maintain the OriPE plasmid were compared. Cells grown in a 10-cm dish were transfected with 8 μg of pc3oriP plasmid expressing EBNA1 (OriPE) (14) using Lipofectamine 2000 (Invitrogen) and, 24 h later, were moved to a 15-cm dish, where they were allowed to grow for 48 h. At this point, 5 × 10⁶ cells were harvested (3-day or 3-cell-doubling time point) to monitor replication of the plasmid. The remaining cells were replated and harvested after 7, 14, 21, and 28 cell doublings to monitor plasmid loss. In all cases, cells were lysed by the Hirt method, and low-molecular-weight DNA was isolated as previously described (1, 14). Recovered plasmids were linearized with XhoI and, where indicated, were also incubated with DpnI to digest unreplicated plasmids. For samples without DpnI digestion, 1/10 of the amount of sample was loaded relative to DpnI-digested samples. DNA was separated by agarose gel electrophoresis, Southern blotted, and probed with 32P-labeled pc3oriP. The position of the DpnI-resistant plasmid is indicated by the asterisk. A similar experiment performed with an OriP plasmid lacking EBNA1 after 3 cell doublings is shown for HeLa cells in lanes 1 and 2 as a negative control. Markers of the positions of linear OriP and OriPE plasmids are shown in lanes 3 and 4. (C) The abilities of CNE2 cells to replicate and maintain plasmids OriP, OriPE, and OriPE,GA (expressing a version of EBNA1 with a long Gly-Ala repeat [described in reference 14]) were monitored as described for panel A. Markers of the positions of linear OriP and OriPE are shown in lanes 7 and 8. (D) Replication and maintenance of OriP, OriPE, and OriPE,GA plasmids in HK-1 cells were followed as described for panel B. (E) Replication and maintenance of pc3oriP and the parental pCAN plasmid without OriP (negative control) were assayed in C666-1 (EBV-positive) cells as described above. Plasmid maintenance was monitored for 3 to 42 cell doublings as indicated (corresponding to 6 to 84 days).
Fig. 2.
Fig. 2.
Comparison of replication of OriPE plasmids in HeLa, CNE2, and C666-1 cells. (A) Cells were transfected with OriPE plasmids and harvested after 3 cell doublings (3 days for HeLa and CNE2 cells and 6 days for C666-1 cells) as described in the legend for Fig. 1B. Plasmid DNA was isolated and linearized as described for Fig. 1B, and 1/10 of the sample was analyzed directly as a recovery control (Input). The remaining sample was incubated with DpnI to digest any plasmid that was not replicated in the human cells (+DpnI). Samples were then analyzed by Southern blotting as described for Fig. 1B, except that pCAN (the backbone of the OriP plasmid) was used as the probe to avoid hybridization with the EBV genomes in C666-1 cells. Each experiment is shown in triplicate (lanes 1, 2, and 3). Only the DpnI-resistant plasmid is shown in the top panel. A marker of the position of linearized OriPE is shown in the first lane. (B) Quantification of the plasmid replication results shown in panel A. Linearized plasmid bands were quantified by phosphorimager analysis using ImageQuant software (Molecular Dynamics), and the intensities of the DpnI-resistant bands were quantified relative to the input band for the same sample. Average values are shown relative to values from CNE2 cells. Error bars indicate standard deviations.
Fig. 3.
Fig. 3.
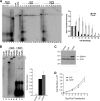
Plasmid maintenance and replication assays in CNE2E cells. (A) CNE2E cells were transfected with pCAN (negative control), OriP, or OriPE plasmid as indicated, harvested after 3 to 56 cell doublings (3 to 56 days), and processed as described in the legend for Fig. 1B. The amount of DpnI-resistant plasmid at each time point (marked by the asterisk) was quantified by phosphorimager analysis from three experiments and plotted relative to the 3-cell-doubling amount, which was set to one (histogram). Average values with standard deviations are shown. (B) Transient-replication assays comparing the bands from OriP and OriPE plasmids after 3 cell doublings before (Input) and after (+DpnI) DpnI digestion. The positions of DpnI-resistant bands are indicated by the asterisk. The histogram shows quantification of DpnI-resistant bands relative to input bands from three experiments. Results are plotted relative to the signal from the OriP plasmid (set to one). Error bars indicate standard deviations. (C) Western blot confirming the overexpression of EBNA1 in OriPE samples compared to endogenous EBNA1 in CNE2E. Total cell lysates (30 μg) are shown from CNE2E 3 days posttransfection with pCAN, OriP, or OriPE plasmid. Blots were probed with antibodies against EBNA1 (a mix of R4 rabbit serum [7] and OT1X monoclonal antibody) and actin (CP01; Calbiochem). Values at left are molecular size markers in kilodaltons. (D) CNE2E cells were transfected with OriP or OriPE plasmid as for replication assays. Cells (1 × 10⁵) were then plated in four 6-cm dishes and harvested and counted 1, 3, 5, or 7 days later. Average cell numbers from three independent experiments are plotted, with standard deviations.
Fig. 4.
Fig. 4.
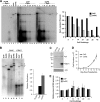
Plasmid maintenance and replication assays in C666-1 cells. (A) C666-1 cells were transfected with pCAN (negative control), OriP, or OriPE plasmid as indicated, harvested after 3 to 42 cell doublings (6 to 84 days), and processed as described in the legend for Fig. 1B, except that pCAN (the backbone of the OriP plasmid) was used as the probe to avoid hybridization with the EBV genomes in C666-1 cells. DpnI-resistant bands were quantified as described in the legend for Fig. 3A, and results are shown in the histogram. (B) Transient-replication assays comparing the bands from OriP and OriPE plasmids after 3 cell doublings (6 days) before (Input) and after (+DpnI) DpnI digestion. The positions of DpnI-resistant bands are indicated by the asterisk. The double bands seen in lanes 5 and 8 are due to incomplete linearization of OriPE, resulting in both nicked (upper band) and linearized (lower band) forms of the plasmid. The histogram shows quantification of DpnI-resistant bands relative to input bands from three experiments. Results are plotted relative to the signal from the OriP plasmid (set to one). Error bars indicate standard deviations. (C) Western blot confirming the overexpression of EBNA1 in OriPE samples (EBNA1) compared to endogenous EBNA1 in C666-1 cells (GA), which is larger due to having a long Gly-Ala repeat region. Total cell lysates (30 μg) from C666-1 cells 6 days posttransfection with pCAN, OriP, or OriPE plasmid were Western blotted as described for Fig. 3C. Values at left are molecular size markers in kilodaltons. (D) C666-1 cells were transfected with OriP or OriPE plasmid as for replication assays. Cells (3 × 10⁵) were then plated in four 6-cm dishes and harvested and counted 4, 8, 12, and 14 days later. Average cell numbers from three independent experiments are plotted, with standard deviations. (E) C666-1 cells were transfected with OriP or OriPE plasmid, and cells were propagated for the indicated numbers of cell doublings before they were lysed in radioimmunoprecipitation assay (RIPA) buffer and total DNA was isolated. Quantitative RT-PCR on the EBV genomes was performed using a primer set for the BZLF1 gene, and results were normalized to the host GAPDH (glyceraldehyde-3-phosphate dehydrogenase) gene. The histogram shows average levels of the EBV genomes and standard deviations from two independent experiments, where the signal from the 3-doubling time point is set to one.

Similar articles

Cited by

References

    1. Ceccarelli D. F. J., Frappier L. 2000. Functional analyses of the EBNA1 origin DNA binding protein of Epstein-Barr virus. J. Virol. 74:4939–4948 - PMC - PubMed
    1. Cheung S. T., et al. 1999. Nasopharyngeal carcinoma cell line (C666-1) consistently harbouring Epstein-Barr virus. Int. J. Cancer 83:121–126 - PubMed
    1. de Jesus O., et al. 2003. Updated Epstein-Barr virus (EBV) DNA sequence and analysis of a promoter for the BART (CST, BARF0) RNAs of EBV. J. Gen. Virol. 84:1443–1450 - PubMed
    1. Dittmer D. P., et al. 2008. Multiple pathways for Epstein-Barr virus episome loss from nasopharyngeal carcinoma. Int. J. Cancer 123:2105–2112 - PMC - PubMed
    1. Frappier L. 2010. EBNA1 in viral DNA replication and persistence, p. 37–59 In Robertson E. S. (ed.), Epstein-Barr virus: latency and transformation. Caister Academic Press, Norwich, United Kingdom

Publication types

MeSH terms

Substances

LinkOut - more resources