

Major histocompatibility complex-dependent cytotoxic T lymphocyte repertoire and functional avidity contribute to strain-specific disease susceptibility after murine respiratory syncytial virus infection
- PMID: 21795345
- PMCID: PMC3196413
- DOI: 10.1128/JVI.00816-11
Major histocompatibility complex-dependent cytotoxic T lymphocyte repertoire and functional avidity contribute to strain-specific disease susceptibility after murine respiratory syncytial virus infection
Abstract
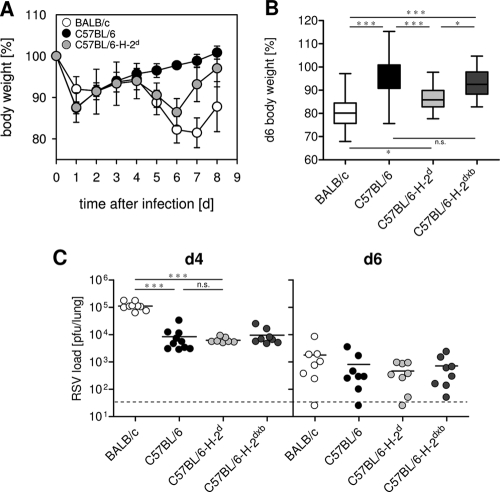
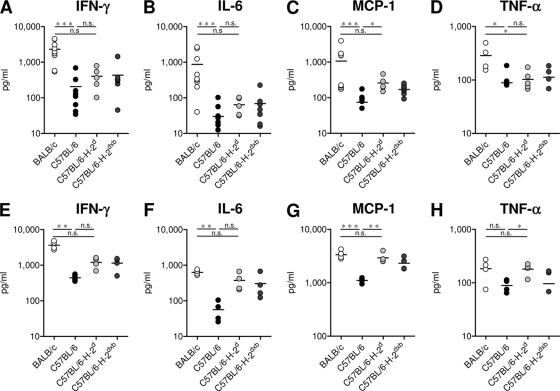
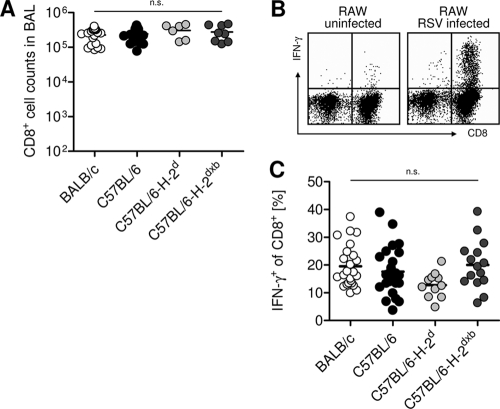
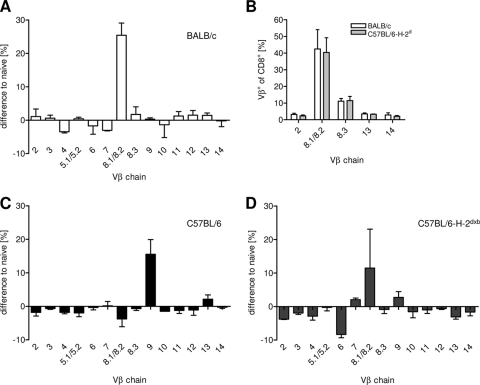
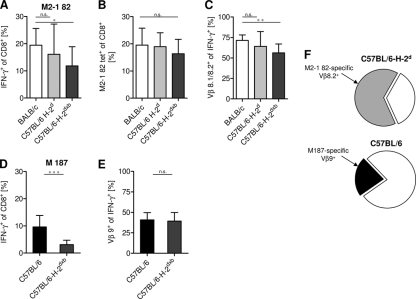
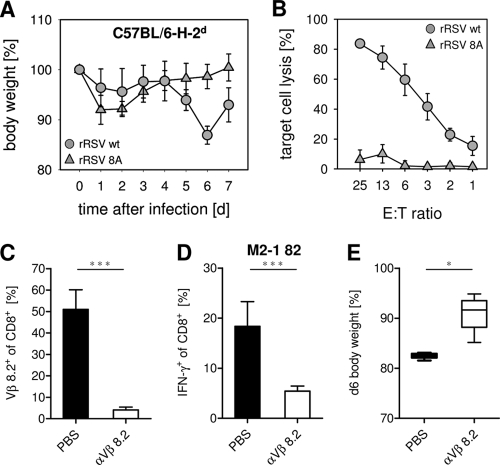
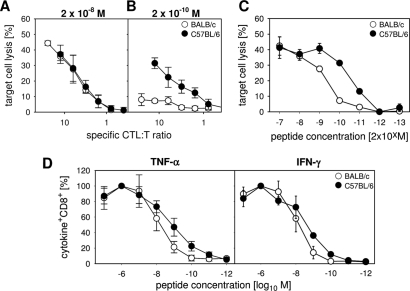
Susceptibility to respiratory syncytial virus (RSV) infection in mice is genetically determined. While RSV causes little pathology in C57BL/6 mice, pulmonary inflammation and weight loss occur in BALB/c mice. Using major histocompatibility complex (MHC)-congenic mice, we observed that the H-2(d) allele can partially transfer disease susceptibility to C57BL/6 mice. This was not explained by altered viral elimination or differences in the magnitude of the overall virus-specific cytotoxic T lymphocyte (CTL) response. However, H-2(d) mice showed a more focused response, with 70% of virus-specific CTL representing Vβ8.2(+) CTL directed against the immunodominant epitope M2-1 82, while in H-2(b) mice only 20% of antiviral CTL were Vβ9(+) CTL specific for the immunodominant epitope M187. The immunodominant H-2(d)-restricted CTL lysed target cells less efficiently than the immunodominant H-2(b) CTL, probably contributing to prolonged CTL stimulation and cytokine-mediated immunopathology. Accordingly, reduction of dominance of the M2-1 82-specific CTL population by introduction of an M187 response in the F1 generation of a C57BL/6N × C57BL/6-H-2(d) mating (C57BL/6-H-2(dxb) mice) attenuated disease. Moreover, disease in H-2(d) mice was less pronounced after infection with an RSV mutant failing to activate M2-1 82-specific CTL or after depletion of Vβ8.2(+) cells. These data illustrate how the MHC-determined diversity and functional avidity of CTL responses contribute to disease susceptibility after viral infection.
Figures
Similar articles
-
Identification of an H-2D(b)-restricted CD8+ cytotoxic T lymphocyte epitope in the matrix protein of respiratory syncytial virus.Virology. 2005 Jul 5;337(2):335-43. doi: 10.1016/j.virol.2005.04.032. Virology. 2005. PMID: 15916793
-
Influence of a single viral epitope on T cell response and disease after infection of mice with respiratory syncytial virus.J Immunol. 2007 Dec 15;179(12):8264-73. doi: 10.4049/jimmunol.179.12.8264. J Immunol. 2007. PMID: 18056370
-
Virus-specific CTL responses induced by an H-2K(d)-restricted, motif-negative 15-mer peptide from the fusion protein of respiratory syncytial virus.J Gen Virol. 2002 Feb;83(Pt 2):429-438. doi: 10.1099/0022-1317-83-2-429. J Gen Virol. 2002. PMID: 11807236
-
Expression of interleukin-4 by recombinant respiratory syncytial virus is associated with accelerated inflammation and a nonfunctional cytotoxic T-lymphocyte response following primary infection but not following challenge with wild-type virus.J Virol. 2005 Aug;79(15):9515-26. doi: 10.1128/JVI.79.15.9515-9526.2005. J Virol. 2005. PMID: 16014914 Free PMC article.
-
The immunodominant, Ld-restricted T cell response to hepatitis B surface antigen (HBsAg) efficiently suppresses T cell priming to multiple Dd-, Kd-, and Kb-restricted HBsAg epitopes.J Immunol. 2002 Jun 15;168(12):6253-62. doi: 10.4049/jimmunol.168.12.6253. J Immunol. 2002. PMID: 12055239
Cited by
-
Functional avidity: a measure to predict the efficacy of effector T cells?Clin Dev Immunol. 2012;2012:153863. doi: 10.1155/2012/153863. Epub 2012 Nov 20. Clin Dev Immunol. 2012. PMID: 23227083 Free PMC article. Review.
-
Respiratory syncytial virus--a comprehensive review.Clin Rev Allergy Immunol. 2013 Dec;45(3):331-79. doi: 10.1007/s12016-013-8368-9. Clin Rev Allergy Immunol. 2013. PMID: 23575961 Free PMC article. Review.
-
Neutrophils do not impact viral load or the peak of disease severity during RSV infection.Sci Rep. 2020 Jan 24;10(1):1110. doi: 10.1038/s41598-020-57969-w. Sci Rep. 2020. PMID: 31980667 Free PMC article.
-
Specific dietary oligosaccharides increase Th1 responses in a mouse respiratory syncytial virus infection model.J Virol. 2012 Nov;86(21):11472-82. doi: 10.1128/JVI.06708-11. Epub 2012 Aug 15. J Virol. 2012. PMID: 22896622 Free PMC article.
-
LAIR-1 Limits Neutrophilic Airway Inflammation.Front Immunol. 2019 Apr 26;10:842. doi: 10.3389/fimmu.2019.00842. eCollection 2019. Front Immunol. 2019. PMID: 31080449 Free PMC article.
References
-
- Amanatidou V., Apostolakis S., Spandidos D. A. 2009. Genetic diversity of the host and severe respiratory syncytial virus-induced lower respiratory tract infection. Pediatr. Infect. Dis. J. 28:135–410 - PubMed
-
- Brandt C. D., et al. 1973. Epidemiology of respiratory syncytial virus infection in Washington, D.C. 3. Composite analysis of eleven consecutive yearly epidemics. Am. J. Epidemiol. 98:355–364 - PubMed
Publication types
MeSH terms
Substances
LinkOut - more resources
Full Text Sources
Other Literature Sources
Medical
Research Materials
