. 2011 Oct;85(19):9778-88.
doi: 10.1128/JVI.00355-11. Epub 2011 Jul 27.

Mechanisms controlling virulence thresholds of mixed viral populations

Affiliations

Mechanisms controlling virulence thresholds of mixed viral populations

Karen Z Lancaster et al. J Virol. 2011 Oct.

Abstract

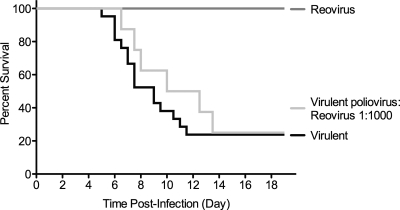
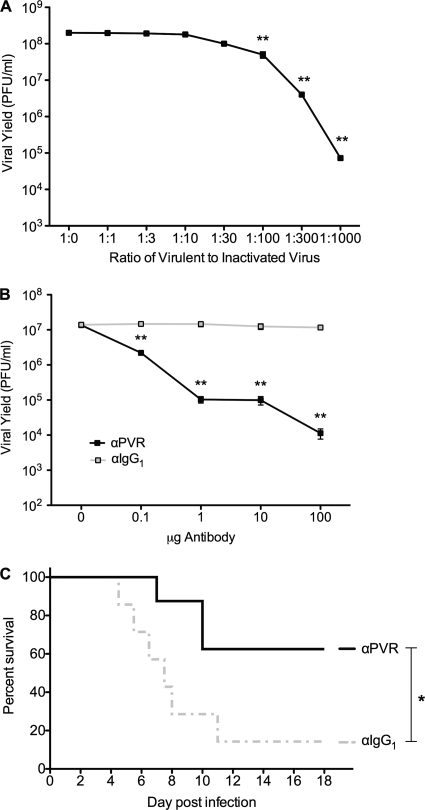
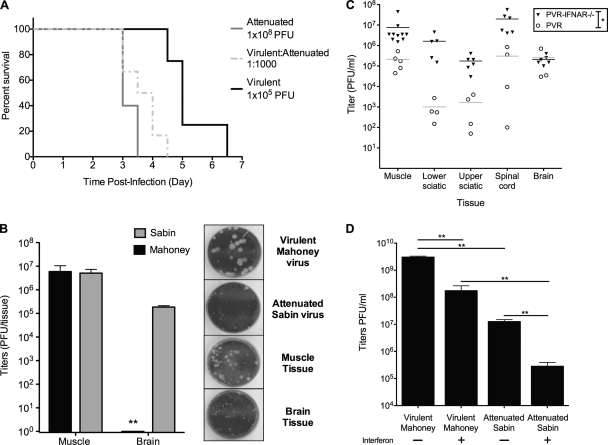
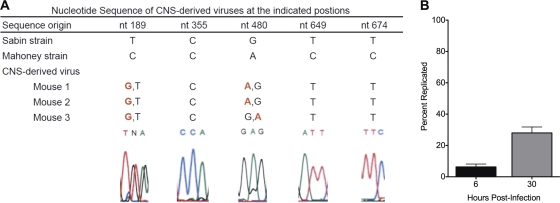
The propensity of RNA viruses to revert attenuating mutations contributes to disease and complicates vaccine development. Despite the presence of virulent revertant viruses in some live-attenuated vaccines, disease from vaccination is rare. This suggests that in mixed viral populations, attenuated viruses may limit the pathogenesis of virulent viruses, thus establishing a virulence threshold. Here we examined virulence thresholds using mixtures of virulent and attenuated viruses in a transgenic mouse model of poliovirus infection. We determined that a 1,000-fold excess of the attenuated Sabin strain of poliovirus was protective against disease induced by the virulent Mahoney strain. Protection was induced locally, and inactivated virus conferred protection. Treatment with a poliovirus receptor-blocking antibody phenocopied the protective effect of inactivated viruses in vitro and in vivo, suggesting that one mechanism controlling virulence thresholds may be competition for a viral receptor. Additionally, the type I interferon response reduces poliovirus pathogenesis; therefore, we examined virulence thresholds in mice lacking the alpha/beta interferon receptor. We found that the attenuated virus was virulent in immunodeficient mice due to the enhanced replication and reversion of attenuating mutations. Therefore, while the type I interferon response limits the virulence of the attenuated strain by reducing replication, protection from disease conferred by the attenuated strain in immunocompetent mice can occur independently of replication. Our results identified mechanisms controlling the virulence of mixed viral populations and indicate that live-attenuated vaccines containing virulent virus may be safe, as long as virulent viruses are present at levels below a critical threshold.


Figures

Fig. 1.
Fig. 1.
Virulence thresholds in mixed populations. (A) Survival curve of adult PVR mice infected with various virus strain combinations. PVR mice were inoculated intramuscularly with 1 × 10⁵ PFU virulent Mahoney virus (black line), 1 × 10⁸ PFU attenuated Sabin virus (dark gray line), 1 × 10⁵ PFU virulent Mahoney virus and 1 × 10⁷ PFU attenuated Sabin virus (dashed gray line), or 1 × 10⁵ PFU virulent Mahoney virus and 1 × 10⁸ PFU attenuated Sabin virus (light gray line) in the left leg. Mice were euthanized after both legs were paralyzed. Data represent data for 6 to 21 mice per group. Data were pooled from all experiments for control mice inoculated with virulent Mahoney virus or attenuated Sabin virus. Statistically significant differences between groups are indicated by asterisks (P < 0.05 by log rank test). (B) Survival curves for 3-week-old PVR mice inoculated with small amounts of virus. Three-week old PVR mice were inoculated intramuscularly with 1 × 10³ PFU virulent Mahoney virus (black line), 1 × 10⁶ PFU attenuated Sabin virus (dark gray line), or 1 × 10³ PFU virulent Mahoney virus and 1 × 10⁶ PFU attenuated Sabin virus (dashed gray line) in the left leg. Mice were euthanized after both legs were paralyzed. Only 6 to 8 of the 3-week-old mice were used per group; therefore, despite the absence of a statistically significant difference between groups, the survival curve of the 3-week-old mice had the same trend as that of the adult mice.
Fig. 2.
Fig. 2.
Pathogenesis of mixed viral populations in PVR mice inoculated in different limbs. Adult PVR mice were inoculated intramuscularly with 1 × 10⁵ PFU virulent Mahoney virus in the left leg (black line), 1 × 10⁸ PFU attenuated Sabin virus in the left leg (gray line), or 1 × 10⁵ PFU virulent Mahoney virus in the left leg and 1 × 10⁸ PFU attenuated Sabin virus in the right leg (dashed gray line). Mice were euthanized after both legs were paralyzed. Data represent data for 6 to 21 mice per group. The curves were not significantly different between mice inoculated in the same legs and those inoculated in different legs (P > 0.05 by log rank test).
Fig. 3.
Fig. 3.
Effect of increased axonal transport on virulence thresholds. PVR mice were inoculated intramuscularly with 1 × 10⁵ PFU virulent Mahoney virus with (dashed black line) or without (black line) needle sticks, 1 × 10⁸ PFU attenuated Sabin virus (dark gray line), or 1 × 10⁵ PFU virulent Mahoney virus and 1 × 10⁸ PFU attenuated Sabin virus with (dashed gray line) or without (light gray line) needle sticks. Mice were euthanized after both legs were paralyzed. Data represent data for 6 to 21 mice per group. Data were pooled from all experiments for control mice inoculated with virulent Mahoney virus or attenuated Sabin virus. The survival curves for mice receiving virulent Mahoney virus were significantly different than those for mice receiving virulent Mahoney virus and needle sticks (P < 0.05 by log rank test). The curves were not significantly different between the Mahoney and Sabin viruses versus Mahoney and Sabin viruses with needle stick groups (P > 0.05 by log rank test).
Fig. 4.
Fig. 4.
Effect of replication-incompetent viruses on virulence thresholds. (A) Replication-incompetent Sabin poliovirus. PVR mice were inoculated intramuscularly with 1 × 10⁵ PFU virulent Mahoney virus (black line), 1 × 10⁸ PFU attenuated Sabin virus (gray line), or 1 × 10⁵ PFU virulent Mahoney virus and 1 × 10⁸ PFU inactivated Sabin virus (dashed gray line). (B) Replication-incompetent Mahoney poliovirus. PVR mice were inoculated intramuscularly with 1 × 10⁵ PFU virulent Mahoney virus (black line), 1 × 10⁸ PFU attenuated Sabin virus (gray line), or 1 × 10⁵ PFU virulent Mahoney virus and 1 × 10⁸ PFU inactivated Mahoney virus (dashed gray line). Mice were euthanized after both hind limbs were paralyzed. Data represent data for 6 to 21 mice per group. The survival curve for mice inoculated with virulent Mahoney virus was significantly different from that for mice receiving virulent Mahoney virus and inactivated Sabin virus or inactivated Mahoney virus (P < 0.05 by log rank test).
Fig. 5.
Fig. 5.
Virulence thresholds with a heterologous virus, reovirus. PVR mice were inoculated intramuscularly with 1 × 10⁵ PFU virulent Mahoney virus (black line), 1 × 10⁸ PFU T3SA+ reovirus (dark gray line), or 1 × 10⁵ PFU virulent Mahoney virus and 1 × 10⁸ PFU T3SA+ reovirus (light gray line) and monitored for disease. Mice were euthanized after both hind limbs were paralyzed. Data represent data for 7 to 21 mice per group. Survival curves were not significantly different between the groups infected with the Mahoney poliovirus alone and the groups receiving Mahoney poliovirus and T3SA+ reovirus (P > 0.05 by log rank test).
Fig. 6.
Fig. 6.
Effect of viral receptor availability on viral yield and pathogenesis. (A) Yield of virulent virus in the presence of inactivated virus. HeLa cells were infected with 1 × 10⁷ PFU Mahoney virus (MOI of 10) with inactivated Sabin virus at 1:0, 1:1, 1:3, 1:10, 1:30, 1:100, 1:300, and 1:1,000 ratios; cell-associated virus was harvested at 5 h postinfection; and the yield was quantified by plaque assay. Boxes indicate means, and error bars represent standard errors of the means (SEM) of duplicates. Asterisks denote statistically significant differences (P < 0.001 by Student's t test). (B) Viral yield in the presence of antibody. HeLa cells were preincubated with 0.1, 1, 10, or 100 μg of anti-CD155/PVR antibody or an anti-IgG1 isotype control antibody, washed, and then infected with 1 × 10⁵ PFU of virulent virus (MOI of 10). Nonbound virus was removed after 10 min by washing, and the viral yield was quantified by a plaque assay of cell-associated virus. Boxes indicate means, and error bars represent SEM of duplicates. Asterisks denote statistically significant differences (P < 0.001 by Student's t test). (C) Survival curve in the presence of antibody. PVR mice were inoculated intramuscularly with 1 × 10⁵ PFU Mahoney poliovirus containing 100 μg of the anti-IgG1 isotype control antibody or 1 × 10⁵ PFU Mahoney poliovirus containing 100 μg of the anti-CD155/PVR antibody. The survival curves for mice inoculated with virulent Mahoney virus and anti-CD155/PVR were significantly different than those for mice receiving virulent Mahoney virus and anti-IgG1 (P < 0.05 by log rank test).
Fig. 7.
Fig. 7.
Impact of the type I interferon response on virulence and viral replication. (A) Survival curve for PVR-IFNAR−/− mice inoculated with virulent Mahoney virus, attenuated Sabin virus, or both. PVR-IFNAR−/− mice were inoculated intramuscularly with 1 × 10⁵ PFU virulent Mahoney virus (black line), 1 × 10⁸ PFU attenuated Sabin virus (dark gray line), or 1 × 10⁵ PFU virulent Mahoney virus and 1 × 10⁸ PFU attenuated Sabin virus (dashed gray line). Mice were euthanized after both legs were paralyzed. Data represent data for 4 to 6 mice per group. (B) Plaque phenotypes and viral titers in tissues harvested from PVR-IFNAR−/− mice inoculated with virulent and attenuated viruses. (Left) Viral titers from PVR-IFNAR−/− mice inoculated intramuscularly with 1 × 10⁵ PFU virulent Mahoney virus and 1 × 10⁸ PFU attenuated Sabin virus were quantified by plaque assay and scored as Mahoney virus (black bars) or Sabin virus (gray bars) according to plaque size. Means and SEM for 6 mice are shown. (Right) Representative plaque assays for muscle and brain tissue are shown below HeLa cells infected with Mahoney virus alone (large plaques) or Sabin virus alone (small plaques) as controls. Statistically significant differences between virus strains in tissue are indicated by asterisks (P < 0.001 by Student's t test). (C) Viral titers in tissues from PVR-IFNAR−/− mice and PVR mice each infected with 1 × 10⁵ PFU Mahoney virus and 1 × 10⁸ PFU Sabin virus. Tissues from PVR and PVR-IFNAR−/− mice were harvested upon disease onset, and the viral titer was quantified for each tissue along the viral trafficking route from muscle to brain. Statistically significant differences in viral titers across all tissues of PVR-IFNAR−/− mice compared to PVR mice are indicated by asterisks (P < 0.01 by one-way ANOVA). (D) Effect of interferon treatment on viral replication. HeLa cells were pretreated with or without IFN-2α for 48 h and infected with 1 × 10⁷ PFU of Sabin virus or Mahoney virus (MOI of 10), cell-associated virus was harvested at 5 h postinfection, and the yield was quantified by plaque assay. Statistically significant differences existed for both viral strains in the absence of interferon and in the presence of interferon (P < 0.001 by Student's t test). Means and SEM for three experiments are shown.
Fig. 8.
Fig. 8.
Nucleotide sequences of virus in the brain of PVR-IFNAR−/− mice coinoculated intramuscularly with Sabin and Mahoney viruses and Sabin virus replication kinetics in muscle. (A) The sequence identity at nucleotide (nt) positions in the 5′ noncoding region is indicated for the attenuated Sabin strain and the virulent Mahoney strain. The presence of the reported mutations in the attenuated Sabin strain was confirmed by sequencing of the inoculum, and the sequence identity reported in the table reflects the inoculum used in the experiments. Sequences of viruses found in the brains of three PVR-IFNAR−/− mice were determined via the sequencing of RT-PCR products. A mixed peak indicates the presence of a mixed viral population in the brain. The nucleotide reported first was more prevalent, as indicated by the relative peak size in the histogram, and mutations differing from the attenuated Sabin strain are indicated in boldface type and red. Below the reported nucleotide sequences are representative histograms from each position to illustrate the sequence and mixed peaks. One nucleotide to the left and one to the right of the nucleotide of interest are shown. (B) Sabin virus replication kinetics in muscle. PVR mice were inoculated intramuscularly with 2 × 10⁷ PFU of light-sensitive Sabin virus, and tissues were harvested at 6 and 30 hpi. The viral replication status was determined by using light-sensitive virus, since any virus that undergoes replication releases the dye conferring light sensitivity. The percentage of viral replication for each sample was determined by dividing the titer obtained from the light-inactivated half of the sample (replicated virus only) by the titer from the half of the sample kept in the dark (overall titer). Data are from 10 tissues per time point, and means and SEM are shown.

Similar articles

Cited by

References

    1. Abecasis A. B., Vandamme A. M., Lemey P. 2009. Quantifying differences in the tempo of human immunodeficiency virus type 1 subtype evolution. J. Virol. 83:12917–12924 - PMC - PubMed
    1. . 2009. Update on vaccine-derived polioviruses—worldwide, January 2008-June 2009. MMWR Morb. Mortal. Wkly. Rep. 58:1002–1006 - PubMed
    1. Arita M., et al. 2005. A Sabin 3-derived poliovirus recombinant contained a sequence homologous with indigenous human enterovirus species C in the viral polymerase coding region. J. Virol. 79:12650–12657 - PMC - PubMed
    1. Barton E. S., Connolly J. L., Forrest J. C., Chappell J. D., Dermody T. S. 2001. Utilization of sialic acid as a coreceptor enhances reovirus attachment by multistep adhesion strengthening. J. Biol. Chem. 276:2200–2211 - PubMed
    1. Bouchard M. J., Lam D. H., Racaniello V. R. 1995. Determinants of attenuation and temperature sensitivity in the type 1 poliovirus Sabin vaccine. J. Virol. 69:4972–4978 - PMC - PubMed

Publication types