. 2011 Oct;85(19):10252-60.
doi: 10.1128/JVI.05548-11. Epub 2011 Jul 27.

Longitudinal analysis of the human T cell response during acute hantavirus infection

Affiliations

Longitudinal analysis of the human T cell response during acute hantavirus infection

Therese Lindgren et al. J Virol. 2011 Oct.

Abstract

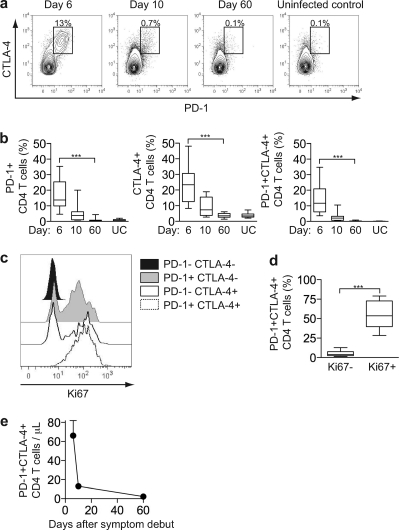
Longitudinal studies of T cell immune responses during viral infections in humans are essential for our understanding of how effector T cell responses develop, clear infection, and provide long-lasting immunity. Here, following an outbreak of a Puumala hantavirus infection in the human population, we longitudinally analyzed the primary CD8 T cell response in infected individuals from the first onset of clinical symptoms until viral clearance. A vigorous CD8 T cell response was observed early following the onset of clinical symptoms, determined by the presence of high numbers of Ki67(+)CD38(+)HLA-DR(+) effector CD8 T cells. This response encompassed up to 50% of total blood CD8 T cells, and it subsequently contracted in parallel with a decrease in viral load. Expression levels of perforin and granzyme B were high throughout the initial T cell response and likewise normalized following viral clearance. When monitoring regulatory components, no induction of regulatory CD4 or CD8 T cells was observed in the patients during the infection. However, CD8 as well as CD4 T cells exhibited a distinct expression profile of inhibitory PD-1 and CTLA-4 molecules. The present results provide insight into the development of the T cell response in humans, from the very onset of clinical symptoms following a viral infection to resolution of the disease.


Figures

Fig. 1.
Fig. 1.
Identification of effector CD8 T cells after hantavirus infection. (a) Expression of Ki67, CD38, and HLA-DR on CD8 T cells from one representative hantavirus-infected patient at days 6, 10, and 60 after symptom debut and from one representative uninfected control. (b) Frequency of Ki67, CD38, and HLA-DR expression on CD8 T cells summarized for hantavirus-infected patients and uninfected controls (n = 15 for all groups; ***, P < 0.0001) (box plots show median, 25th and 75th percentiles, and minimum and maximum). UC, uninfected controls. (c) Frequency of Ki67, CD38, and HLA-DR coexpression on CD8 T cells as determined with Boolean gating summarized for hantavirus-infected patients and uninfected controls (n = 15 for all groups; ***, P < 0.001) (bars represent standard errors of the means [SEM]). (d) Absolute numbers of Ki67+CD38+HLA-DR+ CD8 T cells from patients with hantavirus infection measured over time (n = 15; bars represent SEM). (e) Viral load and frequency of Ki67+CD38+HLA-DR+ CD8 T cells measured over time during acute and convalescent phases shown for three representative hantavirus-infected patients.
Fig. 2.
Fig. 2.
Phenotype of effector CD8 T cells after hantavirus infection. (a) Expression of CCR7, CD45RA, CD28, CD127, granzyme B, and perforin on Ki67+ and Ki67 CD8 T cells from one representative patient with hantavirus infection at day 6 after symptom debut. (b) Frequency of CCR7, CD28, CD45RA, and CD127 coexpression as determined with Boolean gating summarized for Ki67+ and Ki67 CD8 T cells from patients with hantavirus infection at day 6 following symptom debut as well as uninfected controls (n = 15 for all groups; ***, P < 0.001) (bars represent SEM). (c) Frequency of perforin and granzyme B expression on CD8 T cells summarized for hantavirus-infected patients and uninfected controls (n = 15 for all groups; ***, P < 0.0001, **, P = 0.0010). UC, uninfected controls. (d) Frequency of perforin and granzyme B double-positive Ki67 and Ki67+ CD8 T cells from hantavirus-infected patients at day 6 after symptom debut (n = 15 for both groups; ***, P < 0.0001). Box plots (in panels c and d) show median, 25th and 75th percentiles, and minimum and maximum.
Fig. 3.
Fig. 3.
Numbers of FoxP3+ CD4 T cells remain unchanged during acute hantavirus infection. (a) Expression of FoxP3, CD127, and CD25 on CD4 T cells from one representative patient with acute hantavirus infection at day 6 after symptom debut. (b) Frequency of FoxP3+ CD4 T cells summarized for hantavirus-infected patients and uninfected controls (n = 15 for all groups). UC, uninfected controls. (c) Absolute numbers of FoxP3+ CD4 T cells from hantavirus-infected patients measured over time (n = 15; bars represent SEM, dashed lines represent upper and lower SEM intervals for means of FoxP3+ CD4 T cell numbers summarized for 15 uninfected controls). n.s., not significant. (d) Expression of FoxP3 and Ki67 on CD4 T cells from one representative patient with acute hantavirus infection at day 6 and from one uninfected control. Percentages denote relative frequencies of Ki67+ cells within FoxP3+ and FoxP3 CD4 T cells. (e) Frequency of Ki67+FoxP3+ and Ki67+FoxP3CD4 T cells summarized for hantavirus-infected patients over time and for uninfected controls (n = 15; **, P = 0.0046). UC, uninfected controls. Box plots (in panels B and E) show median, 25th and 75th percentiles, and minimum and maximum.
Fig. 4.
Fig. 4.
Proliferating CD8 T cells express inhibitory CTLA-4, but not PD-1, early after hantavirus infection. (a) Expression of Ki67 and PD-1 on CD8 T cells from one representative patient with acute hantavirus infection and from one uninfected control. (b) Expression of Ki67 and CTLA-4 on CD8 T cells from one representative patient with acute hantavirus infection and from one uninfected control. (c) Frequency of PD-1 expression on CD8 T cells summarized for hantavirus-infected patients and for uninfected controls (n = 15 for all groups). (d) Frequency of CTLA-4 expression on CD8 T cells summarized for hantavirus-infected patients and for uninfected controls (n = 15 for all groups; ***, P < 0.001). (e) Frequency of CTLA-4+Ki67 and CTLA-4+Ki67+ CD8 T cells from hantavirus-infected patients at day 6 after symptom debut (n = 15 for both groups, ***, P < 0.0001). Box plots (in panels c, d, and e) show median, 25th and 75th percentiles, and minimum and maximum. UC (in panels c and d), uninfected controls.
Fig. 5.
Fig. 5.
CD4 T cells coexpress inhibitory CTLA-4 and PD-1 during acute hantavirus infection. (a) Expression of CTLA-4 and PD-1 on CD4 T cells from one representative patient with acute hantavirus infection and from one uninfected control. (b) Frequency of PD-1 and CTLA-4 expression on CD4 T cells summarized for hantavirus-infected patients and for uninfected controls (n = 15 for all groups; ***, P < 0.0001). UC, uninfected control. (c) Expression of Ki67 on CD4 T cells expressing different combinations of CTLA-4 and PD-1 from one representative patient with acute hantavirus infection at day 6 after symptom debut. (d) Frequency of PD-1 and CTLA-4 double-positive Ki67 and Ki67+ CD4 T cells from hantavirus-infected patients at day 6 after symptom debut (n = 15 for all groups; ***, P < 0.0001). (e) Absolute numbers of PD-1+CTLA-4+CD4 T cells from patients with hantavirus infection measured over time (n = 15; bars represent SEM). Box plots (in panels b and d) show median, 25th and 75th percentiles, and minimum and maximum.

References

    1. Akondy R. S., et al. 2009. The yellow fever virus vaccine induces a broad and polyfunctional human memory CD8+ T cell response. J. Immunol. 183:7919–7930 - PMC - PubMed
    1. Appay V., et al. 2002. Memory CD8+ T cells vary in differentiation phenotype in different persistent virus infections. Nat. Med. 8:379–385 - PubMed
    1. Barber D. L., et al. 2006. Restoring function in exhausted CD8 T cells during chronic viral infection. Nature 439:682–687 - PubMed
    1. Björkström N. K., et al. 2010. Analysis of the KIR repertoire in human NK cells by flow cytometry. Methods Mol. Biol. 612:353–364 - PubMed
    1. Björkström N. K., et al. 2011. Rapid expansion and long-term persistence of elevated NK cell numbers in humans infected with hantavirus. J. Exp. Med. 208:13–21 - PMC - PubMed

Publication types

MeSH terms