. 2011 Oct;39(19):e129.
doi: 10.1093/nar/gkr601. Epub 2011 Jul 27.

Quantitative single cell monitoring of protein synthesis at subcellular resolution using fluorescently labeled tRNA

Affiliations

Quantitative single cell monitoring of protein synthesis at subcellular resolution using fluorescently labeled tRNA

Sima Barhoom et al. Nucleic Acids Res. 2011 Oct.

Abstract

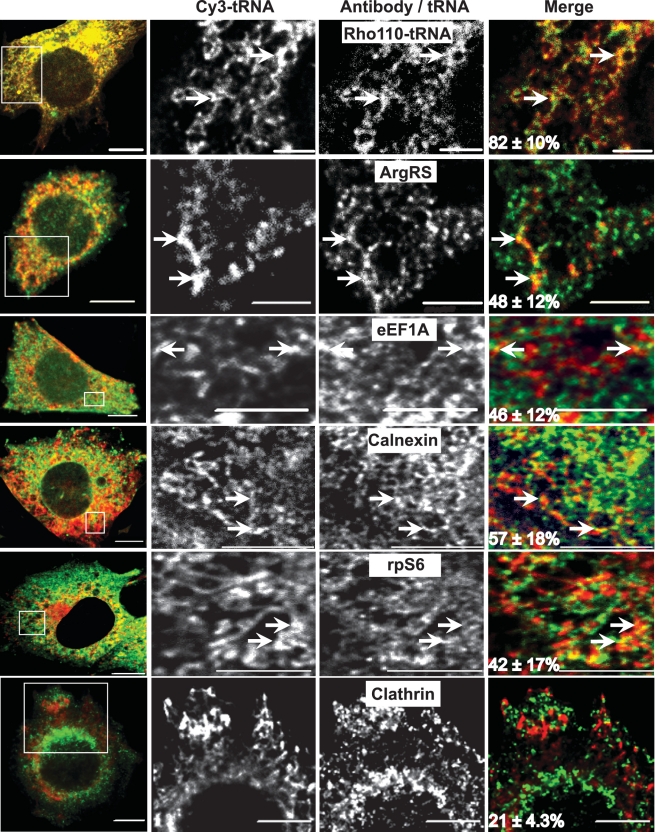
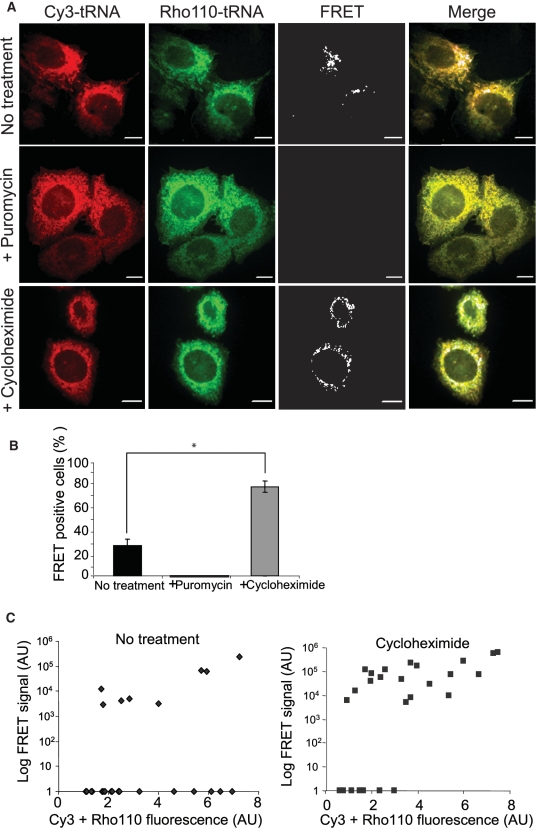
We have developed a novel technique of using fluorescent tRNA for translation monitoring (FtTM). FtTM enables the identification and monitoring of active protein synthesis sites within live cells at submicron resolution through quantitative microscopy of transfected bulk uncharged tRNA, fluorescently labeled in the D-loop (fl-tRNA). The localization of fl-tRNA to active translation sites was confirmed through its co-localization with cellular factors and its dynamic alterations upon inhibition of protein synthesis. Moreover, fluorescence resonance energy transfer (FRET) signals, generated when fl-tRNAs, separately labeled as a FRET pair occupy adjacent sites on the ribosome, quantitatively reflect levels of protein synthesis in defined cellular regions. In addition, FRET signals enable detection of intra-populational variability in protein synthesis activity. We demonstrate that FtTM allows quantitative comparison of protein synthesis between different cell types, monitoring effects of antibiotics and stress agents, and characterization of changes in spatial compartmentalization of protein synthesis upon viral infection.


Figures

Figure 1.
Figure 1.
Transfected Cy3-labeled yeast tRNA shows partial co-localization with cellular factors involved in protein synthesis. CHO cells were transfected with bulk Rho110-labeled and/or Cy3-labeled yeast tRNA, fixed 7 h post transfection and immunostained for ArgRS, eEF1A, calnexin, ribosomal S6 (rpS6) or clathrin as indicated. Panels depict a single middle plane of representative cells imaged with a spinning disc confocal microscope (prior to or following deconvolution employing the constrained iterative algorithm of Slidebook™). Pictures of randomly selected cells (n = 30 for each condition) were employed for the calculation of the co-localization and Pearson's correlation coefficient of the fluorescent signals obtained with the different wavelengths (CL and CCF). The percentage of Cy3-fl-tRNA co-localizing with the different cellular components (or Rho110-tRNA) appears at the lower left hand corner of the merged images. CCF values are detailed in Supplementary Figure S3. Bars are 5 μm.
Figure 2.
Figure 2.
Puromycin alters the intracellular distribution of transfected fl-tRNA. (A) Live cell imaging of puromycin treatment. CHO cells, transfected with Cy3-labeled yeast tRNA and treated with puromycin (1 mM, 7 h post transfection, up to 90 min treatment) were imaged by fluorescence time-lapse microscopy (90 min, 30 s between frames). Time-lapse sequence (shown in its entirety in Supplementary Movie S1) was deconvolved with the No Neighbors algorithm and submitted to a Gaussian filter with Slidebook™. Upper panels depict the first and last frames of the sequence. Lower panels are the ‘close-up’ of the indicated inset. Bars are 5 μm. (B and C) Puromycin increases the nucleus-to-cytoplasmic ratio of fl-tRNA fluorescence. CHO cells, transfected as in Figure 1, were treated with puromycin (1 mM, 30 min) prior to fixation, permeabilization and staining against DNA and calnexin. Cells were imaged by confocal microscopy (n = 50) and the percentage of Cy3-tRNA co-localizing with the DAPI signal was calculated by intensity-based segmentation with Slidebook™. Graph depicts the average ± SD of the percentage of Cy3-tRNA showing nuclear localization. *P < 10−27.
Figure 3.
Figure 3.
FRET assay involving Cy3- and Rho110-labeled tRNAs identifies protein synthesis sites. (A) FRET signals are sensitive to protein synthesis inhibitors. Cells were co-transfected with bulk Cy3- and Rho110-labeled yeast tRNAs, at 7 h post transfection, were treated or not with puromycin or cycloheximide prior to fixation and imaging. Panels show representative cells. Bars are 5 μm. (B) Percentage of cells showing a specific FRET signal. Graph depicts the average ±SD of the percentage of FRET positive cells in 15 fields per condition, from two independent experiments. *P < 0.05. (C) Cycloheximide enhances FRET signal intensity. Graphs depict the correlation of the FRET and total fluorescence signal of single cells in untreated and cycloheximide-treated conditions (n = 30). Note: the arbitrary units (AU) are not identical between panels.
Figure 4.
Figure 4.
Thapsigargin (Tg) reduces protein synthesis and tRNA-mediated FRET. (A) CHO cells at 7 h post transfection with Cy3-labeled tRNA were treated with Tg (0, 1 or 2 μM, 15 min), prior to incubation with 35[S]-Met/Cys (30 min, 20 µCi/ml). Cells were subsequently lysed and 35[S]-Met/Cys incorporation was measured as previously described (14). The graph depicts average ±SD of three independent experiments done in triplicates. *P < 0.0002. (B) Cells transfected with both Cy3- and Rho110-labeled yeast tRNAs, were treated or not with 2 μM Tg for 15 min and subsequently fixed and imaged. The specific FRET signal (FRETc) was calculated as described in ‘Materials and Methods’. Graph depicts the percentage of FRET-positive cells in 15 randomly selected fields per condition from three independent experiments. *P < 0.03. (C) Tg reduces FRET signal intensity. Graphs show correlation of FRET and of total fluorescence signals (direct measurements of Cy3 and Rho110) of single cells (n = 50) in untreated and Tg treated condition. Note: the arbitrary units (AU) are not identical between panels.
Figure 5.
Figure 5.
FtTM measures differences in protein synthesis between resting and activated astrocytes. (A) Mouse primary astrocytes prior to or following activation with 2 µg/ml LPS and 3 ng/ml INFγ for 24 h, were assayed by FtTM. Panels show representative cells. Normalization of the fluorescence signal was identical to allow visual comparison. Bars are 10 μm. (B) Quantification of the percentage of cells which show specific FRET signal. Graph depicts the percentage of FRET-positive cells in randomly selected fields. n = 30 cells/experiment/condition), two independent experiments. *P < 0.03. (C) Levels of 35[S]-Met/Cys incorporation directly correlate with FtTM measurements. Transfected astrocytes (resting or activated) and CHO cells were labeled with 35[S]-Met/Cys (30 min, 20 µCi/ml). Cells were subsequently lysed and 35[S]-Met/Cys incorporation was measured as previously described (14). Graph depicts the average ±SD of three independent experiments done in duplicates.*P < 5E-7; **P < 1E-12.
Figure 6.
Figure 6.
Co-localization of EHDV2-IBAV NS2 protein and fl-tRNA and rpS6 reveals infection-dependent compartmentalization of protein synthesis. (A) CHO cells, infected with EHDV2-IBAV (MOI = 1; 30 h), labeled with 35[S]-Met/Cys (15 μCi/ml, 10 min, 37°C), were lysed and processed by SDS–PAGE. Nitrocellulose blots were either visualized with a phosphor-imager (left panel) or immunoblotted with monoclonal anti-NS2 antibodies (right panel). Arrows indicate putative NS2 bands in the radioactive blot. (B) CHO cells were infected as in (A) and transfected at 30 h post infection with Cy3 fl-tRNA. At 7 h post transfection, cells were fixed, immunostained (anti-NS2/Alexa-488 goat-anti-mouse) and imaged (CCF, lower left hand corner of merge image; arrows point to co-localizations). (C) CHO cells, infected as in (A) and co-transfected with Cy3 and Rho110 fl-tRNA were immunostained (anti-NS2/Alexa 648 goat-anti-mouse). Arrows point to typical triple co-localizations. Note: due to imaging constraints the NS2 image of the same field was acquired through a different microscope port. (D) CHO cells, infected as above, were imaged by electron microscopy. Micrographs show: entire cell (left, arrows indicate factories), a close-up of the viral factory with interspersed virions (middle), accumulation of electron dense spots in the factory vicinity (elipse points to typical accumulations, interpreted as ribosomes). (E) CHO cells, infected as above, were stained with anti-NS2 and anti-rpS6 antibodies and imaged by confocal microscopy (arrows point to typical instances of co-localization, CCF at the lower left hand corner of merged picture). Bars in B, C and E are 10 μm and in D are 2 µm, 1 µm and 500 nm (left to right, respectively).

References

    1. Besse F, Ephrussi A. Translational control of localized mRNAs: restricting protein synthesis in space and time. Nat. Rev. Mol. Cell Biol. 2008;9:971–980. - PubMed
    1. Kindler S, Wang H, Richter D, Tiedge H. RNA transport and local control of translation. Annu. Rev. Cell Dev. Biol. 2005;21:223–245. - PMC - PubMed
    1. Rodriguez AJ, Czaplinski K, Condeelis JS, Singer RH. Mechanisms and cellular roles of local protein synthesis in mammalian cells. Curr. Opin. Cell Biol. 2008;20:144–149. - PMC - PubMed
    1. Tsien RY. The green fluorescent protein. Annu. Rev. Biochem. 1998;67:509–544. - PubMed
    1. Netherton C, Moffat K, Brooks E, Wileman T. A guide to viral inclusions, membrane rearrangements, factories, and viroplasm produced during virus replication. Adv. Virus Res. 2007;70:101–182. - PMC - PubMed

Publication types