. 2011 Oct;21(10):1650-8.
doi: 10.1101/gr.121145.111. Epub 2011 Jul 27.

Regulation of nucleosome landscape and transcription factor targeting at tissue-specific enhancers by BRG1

Affiliations

Regulation of nucleosome landscape and transcription factor targeting at tissue-specific enhancers by BRG1

Gangqing Hu et al. Genome Res. 2011 Oct.

Abstract

Enhancers of transcription activate transcription via binding of sequence-specific transcription factors to their target sites in chromatin. In this report, we identify GATA1-bound distal sites genome-wide and find a global reorganization of the nucleosomes at these potential enhancers during differentiation of hematopoietic stem cells (HSCs) to erythrocytes. We show that the catalytic subunit BRG1 of BAF complexes localizes to these distal sites during differentiation and generates a longer nucleosome linker region surrounding the GATA1 sites by shifting the flanking nucleosomes away. Intriguingly, we find that the nucleosome shifting specifically facilitates binding of TAL1 but not GATA1 and is linked to subsequent transcriptional regulation of target genes.


Figures
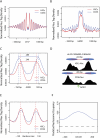
Figure 1.
Figure 1.
Nucleosomes are reorganized at distal GATA1 binding sites during differentiation of HSCs. (A) Nucleosomes are well positioned surrounding the 18,777 CTCF binding sites shared by both HSCs and CD36+ cells. The nucleosome distribution in HSCs and CD36+ cells was obtained using MNase-seq, and the normalized nucleosome tag densities were plotted for a 3-kb region surrounding the CTCF binding sites. The genomic averages are about 0.0003 for both libraries. (B) The normalized nucleosome tag densities were plotted for a region of ±1500 bp surrounding the 24,491 distal GATA1 sites in HSCs and CD36+ cells. (C) The same as in B, except that only the 20,284 GATA1 binding sites that are located in the linker region in HSCs are shown for a region of ±250 bp surrounding the GATA1 sites. (D) UCSC Genome Browser images showing the nucleosome tag densities in HSCs and CD36+ cells surrounding a GATA1 binding site on chr22. The inferred nucleosome positions are indicated by filled ovals. The summit of GATA1 binding in CD36+ cells is indicated by an arrow. (E) The same as in C, except for a set of randomly chosen genomic sites located in linker regions. (F) Predicted nucleosome occupancy surrounding the 20,284 distal GATA1 sites that are located in the linker regions in HSCs, based on intrinsic DNA sequence preferences of nucleosome formation (Kaplan et al. 2009). Genomic averages are shown by dashed line.
Figure 2.
Figure 2.
GATA1 binding is positively correlated with BRG1 binding during differentiation of HSCs. (A) UCSC Genome Browser images showing the colocalization of BRG1 with GATA1 in CD36+ cells. The four DNase I hypersensitive sites (HS) bound by GATA1 in the LCR of the beta-globin domain are indicated at the bottom. (B) Box-plots of BRG1 density at the 24,491 distal GATA1-bound region in HSCs and CD36+ cells. (C) Percentage of GATA1 binding sites that are also bound by BRG1 in HSCs and CD36+ cells. (D) Correlation between GATA1 (black dots) and CTCF (red dots) binding levels with that of BRG1 binding in CD36+ cells. The 30,126 GATA1 or 40,392 CTCF binding sites are binned into groups with equal size of 200 based on the TF binding levels. The densities of BRG1 sequence tags (ln) and the TF tag enrichment scores (ln) from MACS are then averaged for each group. (E) Correlation between the changes in BRG1 binding from HSCs to CD36+ cells at GATA1- or CTCF-bound regions with the levels of GATA1 or CTCF binding in CD36+ cells. The TF binding sites are binned as in D.
Figure 3.
Figure 3.
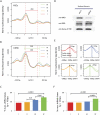
BRG1 mediates nucleosome shifting surrounding the GATA1 sites. (A) Nucleosome profiles in HSCs surrounding the distal GATA1 binding sites that are identified in CD36+ cells. The sites are grouped into four quartiles according to the level of BRG1 binding in CD36+ cells (I to IV denote low to high; 5951 sites per group). The profiles are organized such that the nearest nucleosome is in the upstream of the GATA1 site. Only sites that are predicted at linker regions in both cells are included. (B) Nucleosome profiles in CD36+ cells surrounding the same sites as in A. (C) The percentage of GATA1 binding sites exhibiting a nucleosome shift of >10 bp away from the sites during differentiation of HSCs. The GATA1 sites, which are located at linker regions and have nucleosomes within ±200 bp in both the HSCs and CD36+ cells, are sorted into equal-sized groups (∼600 per group) based on the BRG1 binding levels in the CD36+ cells; I to IV denote the lowest to the highest. P-values are calculated by χ2 test. (D) BRG1 was efficiently knocked down, as shown by the Western blotting analysis of nuclear extracts from the CD36+ cell expressing a small hairpin RNA targeting BRG1 (shBrg1) or the luciferase gene (shLuc) with antibodies indicated on the left. (E) Nucleosome profiles in BRG1 knockdown (dashed lines) and control cells (solid lines) for the region upstream of GATA1 binding sites, which are grouped as in A. (F) The percentage of GATA1 binding sites exhibiting a nucleosome shift of >10 bp toward the sites after knocking down of BRG1 in the CD36+ cells. The GATA1 sites, which are located at linker regions and have nucleosomes within ±200 bp in both the HSCs and CD36+ cells, are sorted into equal-sized groups (∼700 per group) based on the BRG1 binding levels in the CD36+ cells; I to IV denote the lowest to the highest.
Figure 4.
Figure 4.
BRG1 knockdown decreases binding of TAL1 but not GATA1. (A) UCSC Genome Browser images of GATA1 binding in the BRG1 knockdown and control cells. Genomic regions with significantly increased and decreased levels of GATA1 binding (P-value < 0.00001; FC > 1.5) are highlighted in pink and yellow, respectively. (B) GATA1 tag densities around the GATA1 sites in the BRG1 knockdown and control cells. The tag density profiles of 39,702 GATA1-enriched regions are plotted for the control and knockdown cells. (C) The percentage of GATA1 binding sites that showed an increase, decrease, or no change in GATA1 binding in the BRG1 knockdown cells. (D) GATA1 and TAL1 are extensively colocalized in CD36+ cells. (E) UCSC Genome Browser images showing that TAL1 binding was compromised in the BRG1 knockdown cells. Genomic regions with a significant decrease in TAL1 binding (P-value < 0.00001; FC > 1.5) are highlighted in yellow. (F) TAL1 tag densities at the TAL1 sites in the BRG1 knockdown and control cells. The tag density profiles of 34,620 TAL1-enriched regions are plotted for the control and knockdown cells. (G) The percentage of TAL1 binding sites that showed an increase, decrease, or no change in TAL1 binding in the BRG1 knockdown cells.
Figure 5.
Figure 5.
BRG1-induced nucleosome shifting facilitates binding of TAL1. (A) Venn diagram comparison of TAL1 binding sites in HSCs and CD36+ cells. (B) Box-plots for the normalized TAL1 tag density for the three groups of TAL1 sites as specified in A in three cell types (HSCs, BRG1 knockdown CD36+, and control CD36+ cells). (C) Box-plots for the normalized BRG1 density in HSCs and the CD36+ cells for the three groups of TAL1 binding sites as specified in A. (D) Nucleosome profiles in BRG1 knockdown and control cells for the regions centered on the 6046 BRG1-dependent (left panel) or 1665 BRG1-independent TAL1 sites (right panel). See main text for the definition of “BRG1-independent” and “BRG1-dependent” TAL1 binding sites. (E) Percentages of up-regulation and down-regulation among the genes that contain TAL1 binding sites in the region within ±20 kb of the TSSs. Three groups of genes are shown: All TAL1 target genes (6905); Dependent (1542) indicates the group of genes to which TAL1 binding at all associated TAL1 sites was compromised by BRG1 knockdown; and Independent (3302) indicates the groups of genes to which TAL1 binding at none of the associated TAL1 sites was affected by BRG1 knockdown. The standard deviations are calculated by bootstrapping. P-values are calculated by χ2 test. (F) UCSC Genome Browser images showing that the decreased binding of TAL1 is associated with decreased transcription of the CYTL1 gene measured by RNA-seq. The y-axis of RNA-seq tracks is normalized as number of tags per base pair sequence per million tags. (G) A model for the sequential activity of GATA1 binding, recruitment of BRG1, and nucleosome shifting, and binding of TAL1 to the hematopoietic enhancer regions.

References

    1. Armstrong JA, Bieker JJ, Emerson BM 1998. A SWI/SNF-related chromatin remodeling complex, E-RC1, is required for tissue-specific transcriptional regulation by EKLF in vitro. Cell 95: 93–104 - PubMed
    1. Bailey TL, Williams N, Misleh C, Li WW 2006. MEME: Discovering and analyzing DNA and protein sequence motifs. Nucleic Acids Res 34: W369–W373 - PMC - PubMed
    1. Barski A, Cuddapah S, Cui K, Roh TY, Schones DE, Wang Z, Wei G, Chepelev I, Zhao K 2007. High-resolution profiling of histone methylations in the human genome. Cell 129: 823–837 - PubMed
    1. Boyes J, Omichinski J, Clark D, Pikaart M, Felsenfeld G 1998. Perturbation of nucleosome structure by the erythroid transcription factor GATA-1. J Mol Biol 279: 529–544 - PubMed
    1. Bultman S, Gebuhr T, Yee D, La Mantia C, Nicholson J, Gilliam A, Randazzo F, Metzger D, Chambon P, Crabtree G, et al. 2000. A Brg1 null mutation in the mouse reveals functional differences among mammalian SWI/SNF complexes. Mol Cell 6: 1287–1295 - PubMed

Publication types

MeSH terms

Associated data