. 2011 Oct;21(10):1659-71.
doi: 10.1101/gr.125088.111. Epub 2011 Jul 27.

Dynamics of the epigenetic landscape during erythroid differentiation after GATA1 restoration

Affiliations

Dynamics of the epigenetic landscape during erythroid differentiation after GATA1 restoration

Weisheng Wu et al. Genome Res. 2011 Oct.

Abstract

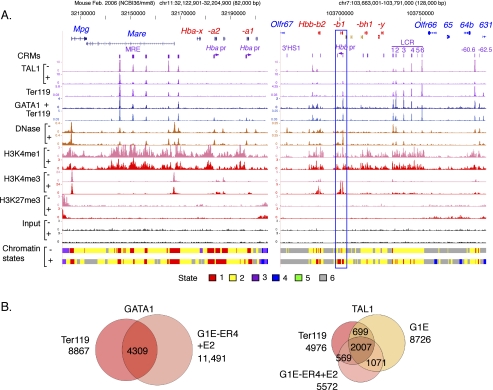
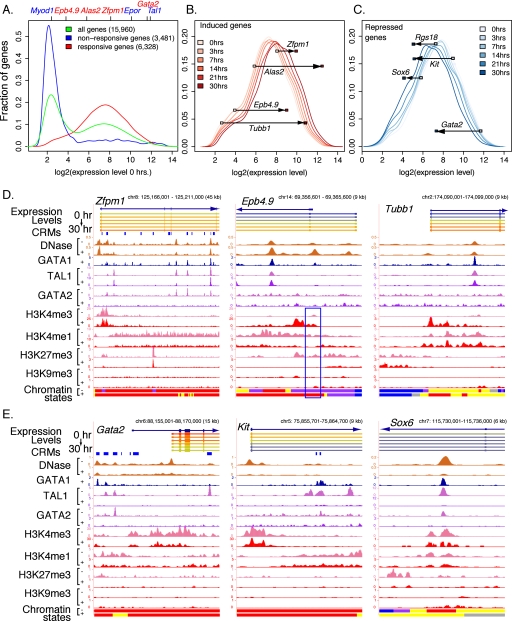
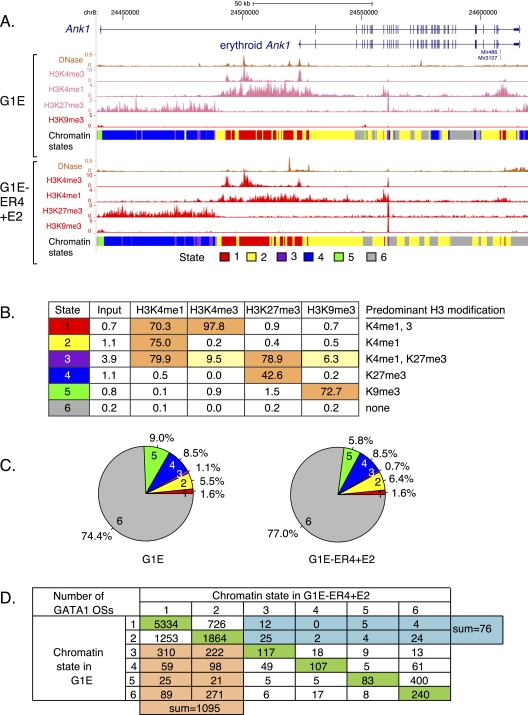
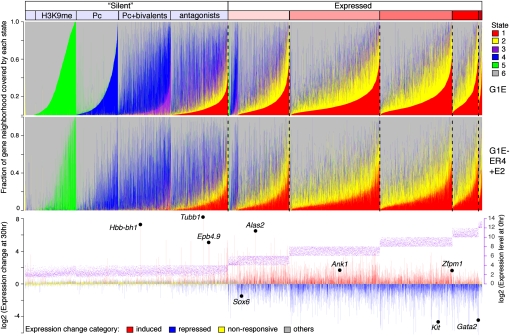
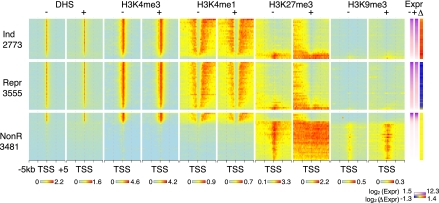
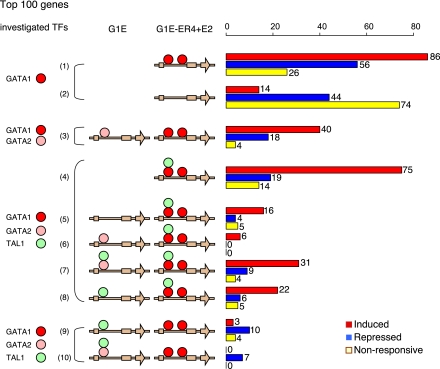
Interplays among lineage-specific nuclear proteins, chromatin modifying enzymes, and the basal transcription machinery govern cellular differentiation, but their dynamics of action and coordination with transcriptional control are not fully understood. Alterations in chromatin structure appear to establish a permissive state for gene activation at some loci, but they play an integral role in activation at other loci. To determine the predominant roles of chromatin states and factor occupancy in directing gene regulation during differentiation, we mapped chromatin accessibility, histone modifications, and nuclear factor occupancy genome-wide during mouse erythroid differentiation dependent on the master regulatory transcription factor GATA1. Notably, despite extensive changes in gene expression, the chromatin state profiles (proportions of a gene in a chromatin state dominated by activating or repressive histone modifications) and accessibility remain largely unchanged during GATA1-induced erythroid differentiation. In contrast, gene induction and repression are strongly associated with changes in patterns of transcription factor occupancy. Our results indicate that during erythroid differentiation, the broad features of chromatin states are established at the stage of lineage commitment, largely independently of GATA1. These determine permissiveness for expression, with subsequent induction or repression mediated by distinctive combinations of transcription factors.


Figures

Figure 1.
Figure 1.
Comparison of ChIP-seq data for transcription factor occupancy between primary erythroid cells and the G1E cell system. (A) Factor binding and histone modification profiles are shown for the Hba locus encoding alpha-globins (left) and the Hbb locus encoding beta-globins (right) on the mouse mm8 assembly. The tracks shown are genes; known cis-regulatory modules (CRMs); TAL1 occupancy; GATA1 occupancy; DNase hypersensitivity; modification of the chromatin by H3K4me1, H3K4me3, or H3K27me3; input (a control in which no antibody is used in the immunoprecipitation); and the chromatin states derived from the multivariate HMM analysis. The signal tracks are paired (identical vertical scales) by the absence (G1E cells, denoted by the minus [−]) or presence (G1E-ER4+E2 cells, denoted by the plus [+]) of GATA1 in the cell line assayed to facilitate comparison of amount of change for each feature (except GATA1, which is absent from G1E cells). TAL1 and GATA1 patterns are also shown for Ter119+ primary erythroblasts. For most tracks, mapped read counts (normalized for the total number of mapped reads in the experiment) in 10-bp windows are plotted; the DNase-seq tracks were processed by F-seq (Boyle et al. 2008b). The blue box outlines the Hbb-b1 gene, which does change chromatin states upon induction during differentiation. (B) Venn diagrams illustrating the overlaps in peaks called for GATA1 and TAL1 in the primary erythroblasts and in the G1E cell system. Total numbers of peaks are listed outside the circles, and the numbers in each intersection are given.
Figure 2.
Figure 2.
Distributions of expression and response of erythroid genes. (A) Distributions of numbers of genes, binned by their initial expression level prior to activation of GATA1-ER. (B,C) Distribution of numbers of induced genes (B) and repressed genes (C) by expression levels, over the time course of differentiation after activation of GATA1-ER. (D,E) Epigenetic features around examples of induced and repressed genes, respectively. Each panel shows the gene (or portion thereof), a color representation of the expression level (low to high is blue to red), erythroid CRMs where known, and signal tracks for the sequence census data on transcription factor occupancy, DNase HSs, and histone modifications. Other conventions are the same as in Figure 1.
Figure 3.
Figure 3.
Segmentation of the mouse erythroid genome based on chromatin modifications. (A) Patterns of histone modifications around the Ank1 gene, showing repression of a nonerythroid promoter by the Polycomb mark H3K27me3 and presence of the erythroid promoter in a state enriched in the trithorax marks H3K4me3 and H3K4me1. (B) The six chromatin states emitted by the model computed by the segmentation program; the emission spectrum for the four modifications and the “input” DNA is listed in the matrix. (C) The proportion of each state on the genome in the two cell lines. (D) Changes in chromatin state between G1E and G1E-ER4+E2 cells for DNA segments occupied by GATA1 in the latter cells. Each GATA1 occupied segment was assigned to the predominant chromatin state in each cell line. The numbers of GATA1 occupied segments that do not change chromatin state are shown in the green cells, those that shift from an active state (state 1 or 2) to an inactive state (state 3–6) are in teal, and those that shift from inactive to active are in orange.
Figure 4.
Figure 4.
Coverage of gene neighborhoods by chromatin states. The fraction of each gene neighborhood covered by each chromatin state (red for the H3K4me1,3-dominated state 1, yellow for the H3K4me1-dominated state 2, purple for the H3K4me1,K27me3-dominated state 3, blue for the H3K27me3-dominated state 4, green for the H3K9me3-dominated state 5, and gray for the low signal state 6) is graphed for G1E cells (top panel) and G1E-ER4+E2 cells (middle panel). For each gene, the expression level is shown as a purple dot, and the change in expression during differentiation is shown as a bar in the third panel (red for induced, blue for repressed, yellow for no change, and gray for other). The gene neighborhoods are partitioned by their level of expression into bins covering two log2 expression levels, except the first bin, which includes all levels less than log2 of 4. Within each expression bin, the genes are ordered first by coverage by state 1 and then by coverage by state 3, state 4, state 5, and state 6.
Figure 5.
Figure 5.
Relationship between levels of epigenetic features around the TSS and expression. Heatmaps showing the distribution of DNase hypersensitivity and the four histone modifications in 10-bp windows through a 10-kb DNA segment centered on the TSS for both G1E and G1E-ER4+E2 cells. Genes in the three response categories (Ind indicates induced; Repr, repressed; NonR, nonresponsive; numbers of genes are given below the category name) were ranked by their expression levels in G1E cells and then placed into groups of 100 genes. In each group, the normalized log2 ChIP-seq counts in the windows at the same position relative to the TSS were aggregated by taking their mean. The expression levels and changes in expression level (average for each group of 100 genes) are shown as heatmaps on the right side.
Figure 6.
Figure 6.
Dynamics of transcription factor occupancy for genes that respond differently to GATA1. Occupancy by TAL1 and/or GATA2 in G1E cells is displayed on the left set of brown arrows (indicating gene neighborhoods), and occupancy by TAL1 and/or GATA1 is displayed on the right set of arrows. Any number of occupied segments for each TF within each gene neighborhood is indicated by the appropriate colored circle (red for GATA1, green for TAL1, and pink for GATA2). Considering the 100 most induced genes (red bars), the 100 most repressed genes (blue bars), and the 100 least responsive genes (yellow bars), the bar graph on the right shows the number of genes in each response category that shows the indicated patterns of occupancy.

References

    1. Anguita E, Hughes J, Heyworth C, Blobel GA, Wood WG, Higgs DR 2004. Globin gene activation during haemopoiesis is driven by protein complexes nucleated by GATA-1 and GATA-2. EMBO J 23: 2841–2852 - PMC - PubMed
    1. Barton MC, Crowe AJ 2001. Chromatin alteration, transcription and replication: What's the opening line to the story? Oncogene 20: 3094–3099 - PubMed
    1. Benjamini Y, Hochberg Y 1995. Controlling the false discovery rate: a practical and powerful approach to multiple testing. J R Stat Soc Ser B Methodol 57: 289–300
    1. Bernstein BE, Mikkelsen TS, Xie X, Kamal M, Huebert DJ, Cuff J, Fry B, Meissner A, Wernig M, Plath K, et al. 2006. A bivalent chromatin structure marks key developmental genes in embryonic stem cells. Cell 125: 315–326 - PubMed
    1. The ENCODE Project Consortium 2007. Identification and analysis of functional elements in 1% of the human genome by the ENCODE pilot project. Nature 447: 799–816 - PMC - PubMed

Publication types

MeSH terms

Associated data