. 2011 Jul 27;31(30):10829-35.
doi: 10.1523/JNEUROSCI.2246-11.2011.

Optogenetic interrogation of dopaminergic modulation of the multiple phases of reward-seeking behavior

Affiliations

Optogenetic interrogation of dopaminergic modulation of the multiple phases of reward-seeking behavior

Antoine R Adamantidis et al. J Neurosci. .

Abstract

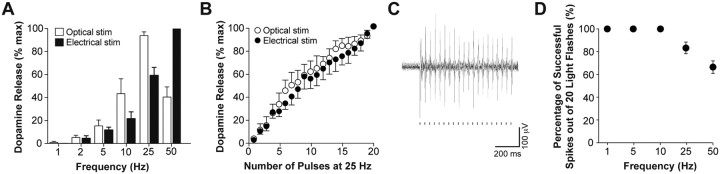
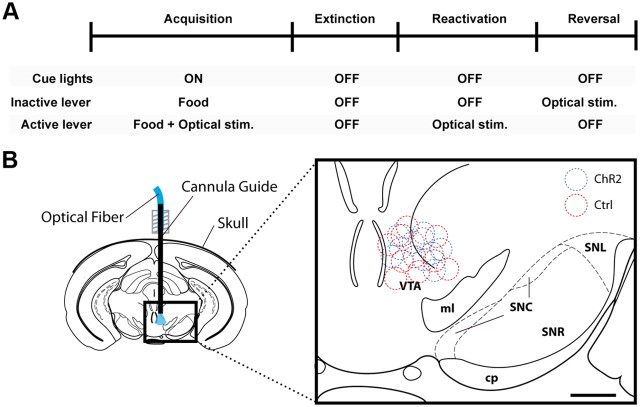
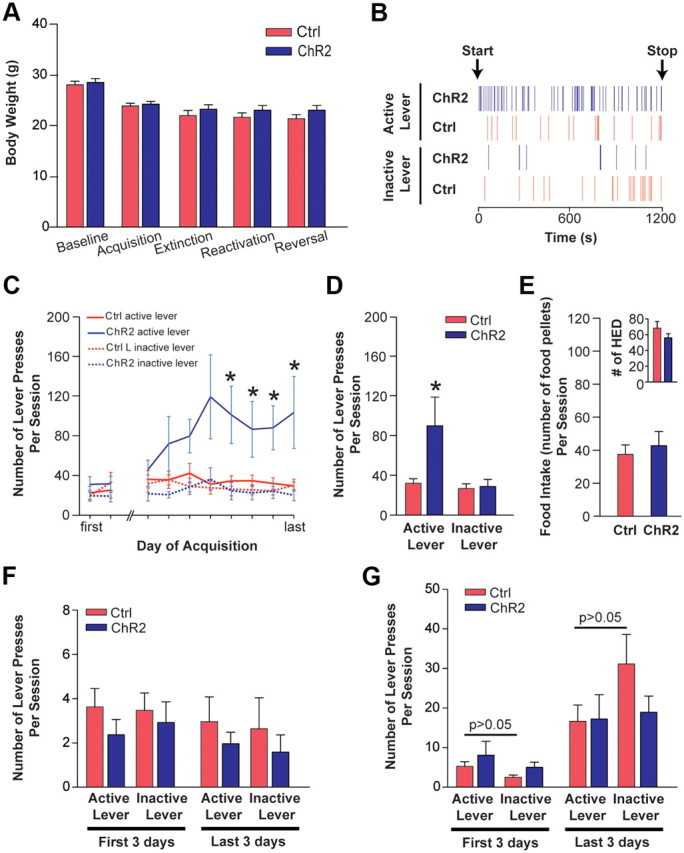
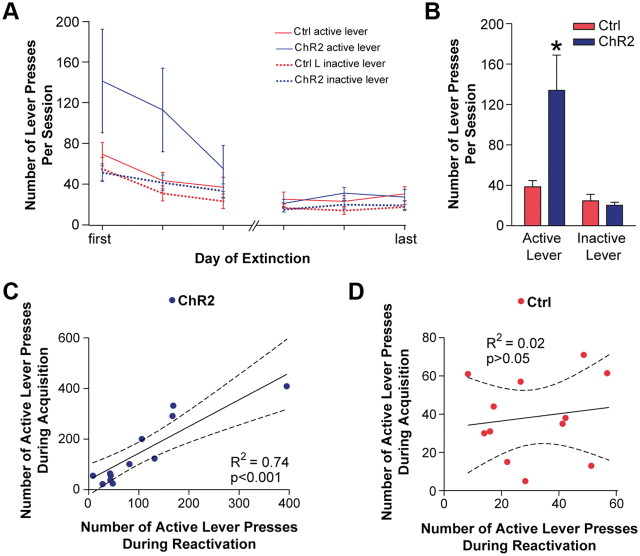
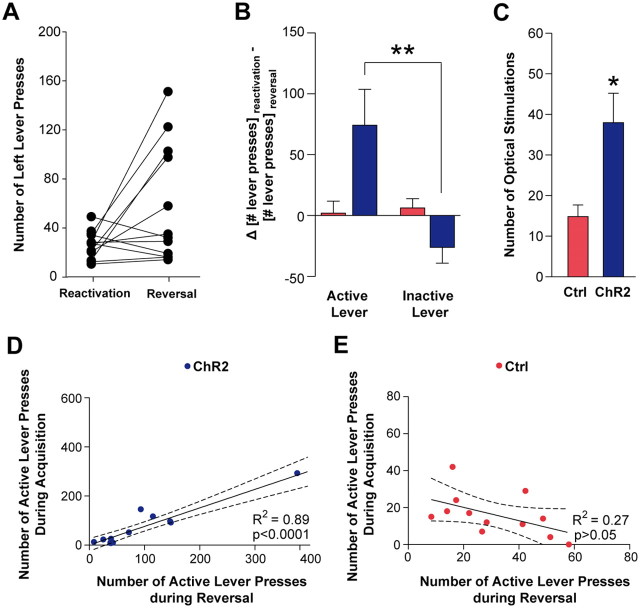
Phasic activation of dopaminergic neurons is associated with reward-predicting cues and supports learning during behavioral adaptation. While noncontingent activation of dopaminergic neurons in the ventral tegmental are (VTA) is sufficient for passive behavioral conditioning, it remains unknown whether the phasic dopaminergic signal is truly reinforcing. In this study, we first targeted the expression of channelrhodopsin-2 to dopaminergic neurons of the VTA and optimized optogenetically evoked dopamine transients. Second, we showed that phasic activation of dopaminergic neurons in freely moving mice causally enhances positive reinforcing actions in a food-seeking operant task. Interestingly, such effect was not found in the absence of food reward. We further found that phasic activation of dopaminergic neurons is sufficient to reactivate previously extinguished food-seeking behavior in the absence of external cues. This was also confirmed using a single-session reversal paradigm. Collectively, these data suggest that activation of dopaminergic neurons facilitates the development of positive reinforcement during reward-seeking and behavioral flexibility.


Figures

Figure 1.
Figure 1.
Optimization of optogenetic control of dopaminergic neurons in vivo. A, In vivo FSCV measurements of optically (white) and electrically induced (black) dopamine transients in the NAcc from anesthetized ChR2-expressing mice over a range of stimulation frequencies (1 to 50 Hz; n = 5). B, Comparison of dopamine transients upon increasing the number (1 to 20) of optical or electrical stimulation (5 ms; n = 3). C, In vivo optrode recording of ChR2-expressing dopaminergic neurons in the VTA showing phasic firing evoked by 25 Hz light pulse trains (20 flashes; 5 ms). D, Percentage of action potentials evoked by 20 light flashes at different frequencies (1 to 50 Hz; n = 3). Error bars indicate SEM.
Figure 2.
Figure 2.
Experimental strategy and verification of cannula placement. A, Timeline of the experimental strategy and instrumental conditions during the acquisition, extinction, reactivation, and reversal phases of the operant behavioral task. B, Representation of the optical–neural interface for deep brain light delivery (left). The optical fiber is shown in blue. The right panel represents the placement of the cannula guides in the brains of ChR2 (blue circles) and control mice (red circles; n = 10 in each group; some brains were lost during tissue processing) that were included in this study [drawings were generated according to the mouse brain atlas of Paxinos and Franklin (2001)]. Scale bar, 500 μm. cp, Cerebral peduncle; ml, medial lemnicus; SNC, substantia nigra pars compacta; SNL, substantia nigra pars lateralis; SNR, substantia nigra pars reticularis.
Figure 3.
Figure 3.
Optogenetic activation of dopaminergic neurons in vivo facilitates positive reinforcement during food-seeking behavior. A, Body weight throughout the behavioral training. ChR2 and control (Ctrl) mice (n = 12 in each group) were food restricted, and their body weight was maintained at 85% of baseline value. Data are expressed as mean ± SEM. B, Representative patterns of lever presses responses (vertical lines) from ChR2 (blue) and control mice (red) during the acquisition phase. C, Time course representation of the behavioral responses during acquisition of food-seeking behavior in ChR2 (blue; n = 12) and control (red; n = 12) mice. Note that the x-axis is interrupted because the duration of the acquisition phase varies among animals due to interindividual variability. D, Quantification of responses at the end of the acquisition phase (n = 12 in each group). E, Food intake (number of food pellets consumed per session) of ChR2 and control mice (n = 12 in each group) at the end of the acquisition phase. Inset, Number of head entries detected (HED) in the food receptacle during the last three days of the acquisition phase in ChR2 and control mice (n = 12 in each group). F, Quantification of the number of responses on the active (i.e., paired with optical stimulation) and the inactive lever from ChR2 and control mice in the absence of food reward (n = 6 in each group). G, Quantification of the number of responses of ChR2 and control mice (n = 6 in each group) during the acquisition of lever-pressing behavior for food reward in the absence of optical stimulation. Data are expressed as the mean ± SEM. *p < 0.05 using a one-way ANOVA analysis followed by Tukey's post hoc test.
Figure 4.
Figure 4.
Optogenetic activation of dopaminergic neurons reactivates previously extinguished reward-seeking behavior. A, Time course representation of the responses during the extinction procedure in ChR2 (blue) and control (red) mice (n = 12 in each group). The x-axis is interrupted since animals showed interindividual variability in the duration of the extinction (6 to 29 d). Note that the total duration required for extinction of self-stimulation behavior was not significantly different between ChR2 and control mice. B, Behavioral responses of ChR2 and control mice during the reactivation session (n = 12 in each group). Data are expressed as the mean ± SEM. *p < 0.05 using a one-way ANOVA followed by Tukey's post hoc test. C, D, Linear regression of the number of responses on the active lever during the last day of the acquisition phase on the reactivation day for ChR2 (C) and control (D) mice. Dashed lines represent the 95% confidence interval. *p < 0.05.
Figure 5.
Figure 5.
Optogenetic activation of dopaminergic neurons participates to behavioral flexibility. A, Individual responses of ChR2 mice on the previously inactive (left) lever during the reactivation and reversal single sessions. B, Representation of the discrimination index (difference of responses on the active and inactive levers during the reactivation and the reversal procedures). Data are expressed as mean ± SEM. **p < 0.01 using a one-way ANOVA followed by Tukey's post hoc test. C, Quantification of the optical stimulations earned by ChR2 and control mice (n = 12 in each group) during the reversal learning procedure. *p < 0.05 using a two-tailed unpaired Student's t test. D, E, Linear regression of the number of responses on the active lever during the last day of the acquisition phase on the reversal day for ChR2 (D) and control (E) mice. Dashed lines represent the 95% confidence interval. *p < 0.05.

Comment in

References

    1. Bayer HM, Glimcher PW. Midbrain dopamine neurons encode a quantitative reward prediction error signal. Neuron. 2005;47:129–141. - PMC - PubMed
    1. Berridge KC. The debate over dopamine's role in reward: the case for incentive salience. Psychopharmacology (Berl) 2007;191:391–431. - PubMed
    1. Berridge KC. ”Liking” and “wanting” food rewards: brain substrates and roles in eating disorders. Physiol Behav. 2009;97:537–550. - PMC - PubMed
    1. Bielajew C, Shizgal P. Evidence implicating descending fibers in self-stimulation of the medial forebrain bundle. J Neurosci. 1986;6:919–929. - PMC - PubMed
    1. Blaha CD, Phillips AG. Application of in vivo electrochemistry to the measurement of changes in dopamine release during intracranial self-stimulation. J Neurosci Methods. 1990;34:125–133. - PubMed

Publication types

MeSH terms