. 2011 Jul 27;31(30):10882-90.
doi: 10.1523/JNEUROSCI.5334-10.2011.

Heritability of working memory brain activation

Affiliations

Heritability of working memory brain activation

Gabriëlla A M Blokland et al. J Neurosci. .

Abstract

Although key to understanding individual variation in task-related brain activation, the genetic contribution to these individual differences remains largely unknown. Here we report voxel-by-voxel genetic model fitting in a large sample of 319 healthy, young adult, human identical and fraternal twins (mean ± SD age, 23.6 ± 1.8 years) who performed an n-back working memory task during functional magnetic resonance imaging (fMRI) at a high magnetic field (4 tesla). Patterns of task-related brain response (BOLD signal difference of 2-back minus 0-back) were significantly heritable, with the highest estimates (40-65%) in the inferior, middle, and superior frontal gyri, left supplementary motor area, precentral and postcentral gyri, middle cingulate cortex, superior medial gyrus, angular gyrus, superior parietal lobule, including precuneus, and superior occipital gyri. Furthermore, high test-retest reliability for a subsample of 40 twins indicates that nongenetic variance in the fMRI brain response is largely due to unique environmental influences rather than measurement error. Individual variations in activation of the working memory network are therefore significantly influenced by genetic factors. By establishing the heritability of cognitive brain function in a large sample that affords good statistical power, and using voxel-by-voxel analyses, this study provides the necessary evidence for task-related brain activation to be considered as an endophenotype for psychiatric or neurological disorders, and represents a substantial new contribution to the field of neuroimaging genetics. These genetic brain maps should facilitate discovery of gene variants influencing cognitive brain function through genome-wide association studies, potentially opening up new avenues in the treatment of brain disorders.


Figures

Figure 1.
Figure 1.
Observed and expected sampling distributions for genetic and environmental parameters. h2 observed = [2*(rMZrDZ)] and c2 observed = [(2*rDZ) − rMZ] (Falconer and Mackay, 1996). h2 and c2 expected are normal distributions with a mean of zero and an expected sampling variance estimated as [4*((1 − rMZ2)2 /m + (1 − rDZ2)2 /n)] for h2 expected, and [(4*(1 − rDZ2)2)/n + ((1 − rMZ2)2/m)] for c2 expected, where n and m refer to the numbers of DZ and MZ twin pairs, respectively, and rMZ and rDZ are set to zero under the null hypothesis of no heritability and no common environmental influence (Visscher, 2004).
Figure 2.
Figure 2.
Group activation, twin correlations, and test-retest reliability. A–C, Group random-effects analysis for the 2-back >0-back t contrast (p < 0.05, FWE corrected) (A), maximum likelihood MZ and DZ twin correlations (B), and test-retest correlations within the group activation mask (C). Confidence intervals for twin and test-retest correlations are available in the supplemental material (available at www.jneurosci.org as supplemental material). Statistical maps are rendered on the Freesurfer inflated brain (CorTechs Labs) (Fischl et al., 1999) using the SPM SurfRend Toolbox (http://spmsurfrend.sourceforge.net; authored by Itamar Kahn, Universität Freiburg, Freiburg, Germany) and NeuroLens (Neurovascular Imaging Laboratory, L'Unité de Neuroimagerie Fonctionnelle, Montréal, QC, Canada), separately for lateral and medial views in the left and right hemispheres.
Figure 3.
Figure 3.
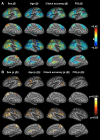
Variance component estimates for n-back task-related brain activation. A, Percentages of variance explained by genetic (a2) and unique environmental factors (e2). B, Probability map for a2, indicating which genetic estimates were significant after height (p < 0.05) and cluster (>147 voxels) thresholding.
Figure 4.
Figure 4.
Covariate effect estimates for sex, age, 2-back performance accuracy, and FIQ. A, Standardized regression coefficients (β values) obtained from multiple regression of task-related activation on sex, age, 2-back performance accuracy, and FIQ in Mx (Neale et al., 2002). Positive effects (i.e., greater activation in males, in older participants, and in participants who performed better on the n-back task or with higher FIQ) are represented by hot colors and negative effects (i.e., greater activation in females, in younger participants, and in participants who performed worse on the n-back task or with lower FIQ) are represented by cold colors. B, Height-thresholded (p < 0.05) and cluster-thresholded (>147 voxels) p value maps corresponding to the regression coefficient maps of sex, age, 2-back performance accuracy, and FIQ.

References

    1. Ando J, Ono Y, Wright MJ. Genetic structure of spatial and verbal working memory. Behav Genet. 2001;31:615–624. - PubMed
    1. Ashburner J, Friston KJ. Nonlinear spatial normalization using basis functions. Hum Brain Mapp. 1999;7:254–266. - PMC - PubMed
    1. Bell EC, Willson MC, Wilman AH, Dave S, Silverstone PH. Males and females differ in brain activation during cognitive tasks. Neuroimage. 2006;30:529–538. - PubMed
    1. Blokland GAM, McMahon KL, Hoffman J, Zhu G, Meredith M, Martin NG, Thompson PM, de Zubicaray GI, Wright MJ. Quantifying the heritability of task-related brain activation and performance during the N-back working memory task: a twin fMRI study. Biol Psychol. 2008;79:70–79. - PMC - PubMed
    1. Caceres A, Hall DL, Zelaya FO, Williams SC, Mehta MA. Measuring fMRI reliability with the intra-class correlation coefficient. Neuroimage. 2009;45:758–768. - PubMed

Publication types

MeSH terms

LinkOut - more resources