. 2011 Jul 27;31(30):10983-92.
doi: 10.1523/JNEUROSCI.0027-11.2011.

Attentional modulation of firing rate varies with burstiness across putative pyramidal neurons in macaque visual area V4

Affiliations

Attentional modulation of firing rate varies with burstiness across putative pyramidal neurons in macaque visual area V4

Emily B Anderson et al. J Neurosci. .

Abstract

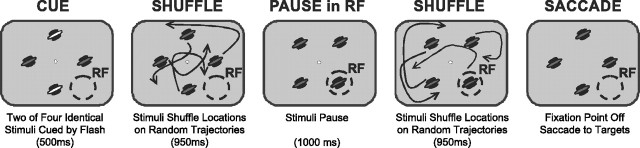
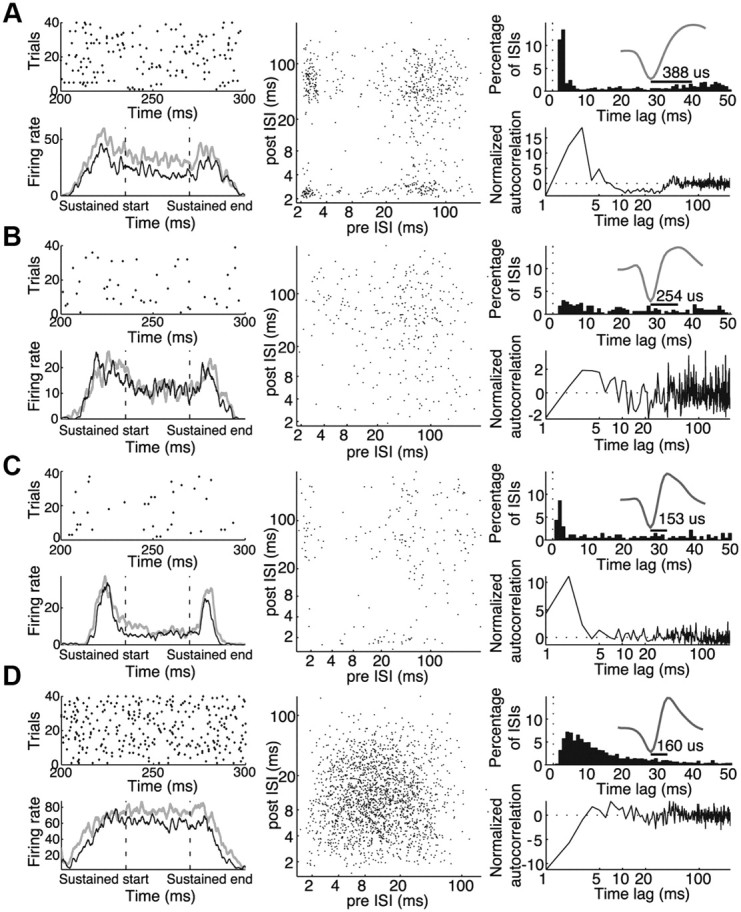
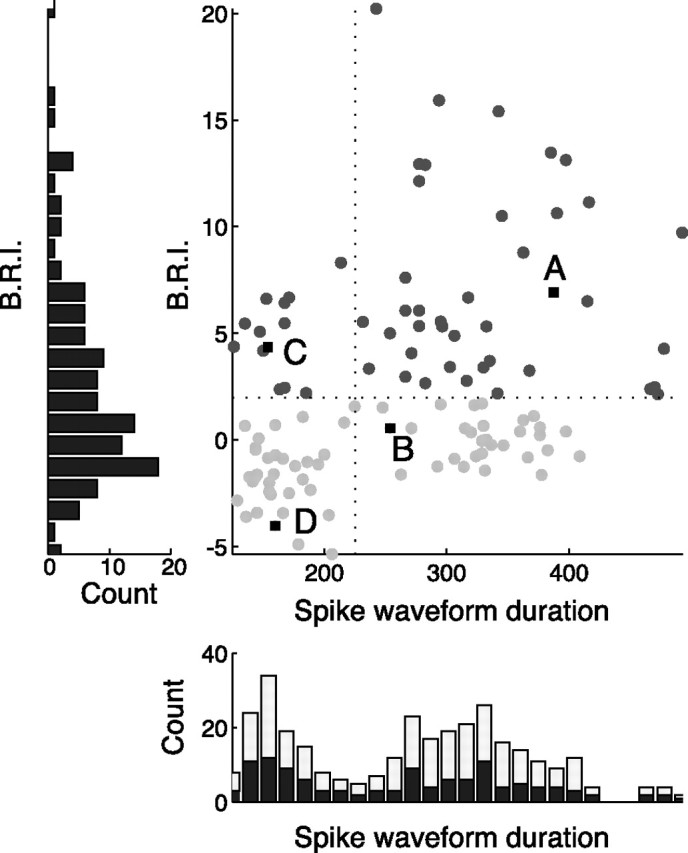
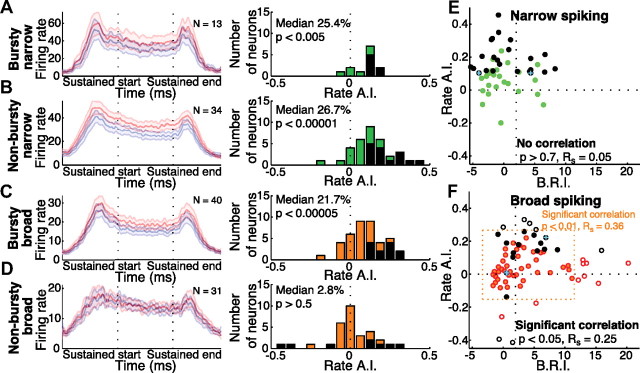
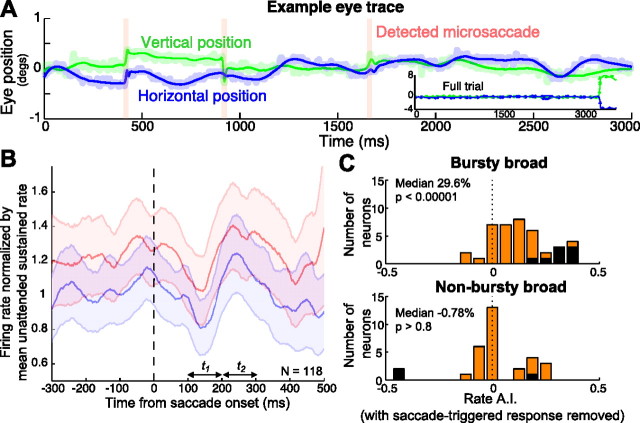
One of the most well established forms of attentional modulation is an increase in firing rate when attention is directed into the receptive field of a neuron. The degree of rate modulation, however, can vary considerably across individual neurons, especially among broad spiking neurons (putative pyramids). We asked whether this heterogeneity might be correlated with a neuronal response property that is used in intracellular recording studies to distinguish among distinct neuronal classes: the burstiness of the neuronal spike train. We first characterized the burst spiking behavior of visual area V4 neurons and found that this varies considerably across the population, but we did not find evidence for distinct classes of burst behavior. Burstiness did, however, vary more widely across the class of neurons that shows the greatest heterogeneity in attentional modulation, and within that class, burstiness helped account for differences in attentional modulation. Among these broad spiking neurons, rate modulation was primarily restricted to bursty neurons, which as a group showed a highly significant increase in firing rate with attention. Furthermore, every bursty broad spiking neuron whose firing rate was significantly modulated by attention exhibited an increase in firing rate. In contrast, non-bursty broad spiking neurons exhibited no net attentional modulation, and, although some individual neurons did show significant rate modulation, these were divided among neurons showing increases and decreases. These findings show that macaque area V4 shows a range of bursting behavior and that the heterogeneity of attentional modulation can be explained, in part, by variation in burstiness.


Figures

Figure 1.
Figure 1.
Attentional state was controlled with a multi-object tracking task. Animals initiated trials by fixating a central point. Four identical Gabor stimuli then appeared, and one or two of them were cued as targets with a brief elevation in luminance. The monkey then maintained fixation while attentively tracking the targets as they moved along independent randomized trajectories that brought one of the stimuli into the receptive field (RF), at which point all four stimuli paused for 1000 ms. The stimuli then shuffled position a second time, with randomized trajectories that placed them at equally eccentric positions outside the receptive field. The fixation point then disappeared, indicating that the monkey should saccade to the previously cued targets. Juice reward was delivered if the monkey correctly made a saccade to each cued stimulus and none of the distracter stimuli.
Figure 2.
Figure 2.
Examples of four individual neurons with varying degrees of burstiness. A, Example of a bursty broad spiking neuron. B, Example of non-bursty broad spiking neuron. C, Example of a bursty narrow spiking neuron. D, Example of a non-bursty narrow spiking neuron. For each neuron, top left panels show spike raster plots of a 100 ms window within the sustained period for the first 40 correct unattended trials. Bottom left panels show the neuronal response (spikes per second) averaged across trials, to targets (gray) and distracters (black) as they entered the receptive field, paused, and exited the receptive field. These response time courses were smoothed by convolving each with a Gaussian kernel (σ = 25 ms). Middle panels show interspike interval return maps for the unattended condition. Each point corresponds to one action potential, plotted to indicate its interspike interval relative to the previous and subsequent spikes. Top right panels show interspike interval histograms (bin width, 4 ms). Insets in the top right panels are normalized mean action potential waveforms, with peak-to-trough duration indicated by horizontal bars. Bottom right panels show the normalized autocorrelation functions (autocorrelation minus the shuffle predictor divided by the SD of the shuffle predictor; see Materials and Methods) for the unattended condition. Dashed line at 0 indicates the normalized autocorrelation function of a rate-matched Poisson process.
Figure 3.
Figure 3.
Population scatter plot of spike waveform duration (microseconds) versus B.R.I. A–D indicate example units from Figure 2. Dark gray circles correspond to bursty neurons, defined as neurons whose burstiness exceeded 2 SDs of a rate-matched Poisson process (B.R.I. > 2). Light gray circles correspond to non-bursty cells. The left panel shows the distribution of the B.R.I. across the population, which was not significantly bimodal. The bottom panel shows the distribution of spike waveform durations, which is significantly bimodal both for visually driven cells (dark bars; Hartigan's dip test, p < 0.01) and the entire population (light bars indicate nonvisually driven neurons; Hartigan's dip test, p < 0.0001).
Figure 4.
Figure 4.
Relationship between burstiness/refractoriness index and attention-dependent rate modulation. A–D, Attention-dependent modulation of firing rate across four groups of V4 neurons: bursty narrow (A), non-bursty narrow (B), bursty broad (C), and non-bursty broad (D). Left columns show population mean stimulus-evoked responses for tracked (red traces) or ignored (blue traces) stimuli (data smoothed with a Gaussian filter in which σ = 25 ms; shaded regions indicate ±1 SEM). The middle column shows the distributions of the firing rate attention index for each population, with individually significant units (p < 0.001) shaded black. E, F, Population scatter plots of B.R.I. versus firing rate A.I. Narrow spiking cells are shown in E (green circles), and broad spiking cells are shown in F (orange circles). Individual units with significant attention-dependent rate modulation (p < 0.001) are shown in black. Points with blue crosses correspond to the example individual neurons in Figures 2 and 3. In F, filled circles indicate broad spiking neurons with rate A.I. and B.R.I. values within 1.5 SD of the broad spiking population mean (indicated by dashed orange box). There is a significant correlation between B.R.I. and rate A.I. across the entire broad spiking population (open and filled circles; Spearman's correlation, p < 0.05, Rs = 0.2499) and for the subset within 1.5 SD of the mean (filled circles; Spearman's correlation, p < 0.01, Rs = 0.3583).
Figure 5.
Figure 5.
Microsaccade-triggered response modulation. A, Single-trial example of the saccade detection algorithm (see Materials and Methods). Blue and green curves correspond to the model fits of the horizontal and vertical eye position, with shaded lines indicating the raw position traces. Detected microsaccades are indicated by pink vertical bars. Inset shows eye position across the entire trial (including the saccade to the cued stimulus at the end of the trial). B, Microsaccade-triggered responses averaged across the entire population. Curves show the population mean of normalized microsaccade-triggered responses to when the stimulus was tracked (red traces) or ignored (blue). Data are smoothed with a Gaussian filter in which σ = 25 ms; shaded regions indicate ±1 SEM. C, Distribution of the firing rate attention index for the bursty and non-bursty broad spiking groups, calculated after removing all action potentials that occurred within 400 ms after a detected microsaccade. Individually significant units (p < 0.001) are shaded black.

References

    1. Agmon A, Connors BW. Correlation between intrinsic firing patterns and thalamocortical synaptic responses of neurons in mouse barrel cortex. J Neurosci. 1992;12:319–329. - PMC - PubMed
    1. Bair W, Koch C, Newsome W, Britten K. Power spectrum analysis of bursting cells in are MT in the behaving monkey. J Neurosci. 1994;14:2870–2892. - PMC - PubMed
    1. Barthó P, Hirase H, Monconduit L, Zugaro M, Harris KD, Buzsáki G. Characterization of neocortical principal cells and interneurons by network interactions and extracellular features. J Neurophysiol. 2004;92:600–608. - PubMed
    1. Brumberg JC, Nowak LG, McCormick DA. Ionic mechanisms underlying repetitive high-frequency burst firing in supragranular cortical neurons. J Neurosci. 2000;20:4829–4843. - PMC - PubMed
    1. Cavanagh P, Alvarez GA. Tracking multiple targets with multifocal attention. Trends Cogn Sci. 2005;9:349–354. - PubMed

Publication types

LinkOut - more resources