. 2011 Jul 27;31(30):11016-27.
doi: 10.1523/JNEUROSCI.0210-11.2011.

How ongoing neuronal oscillations account for evoked fMRI variability

Affiliations

How ongoing neuronal oscillations account for evoked fMRI variability

Robert Becker et al. J Neurosci. .

Abstract

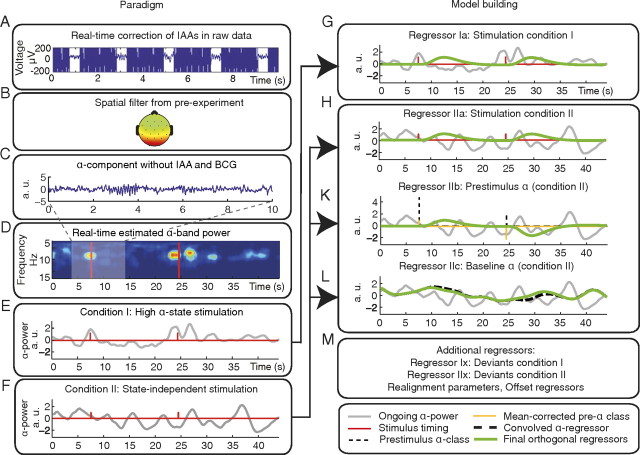
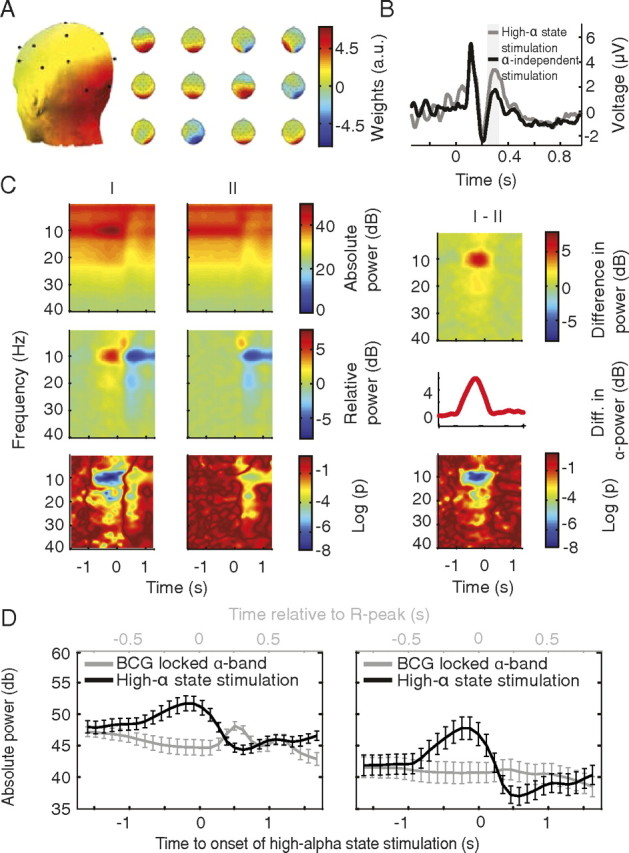
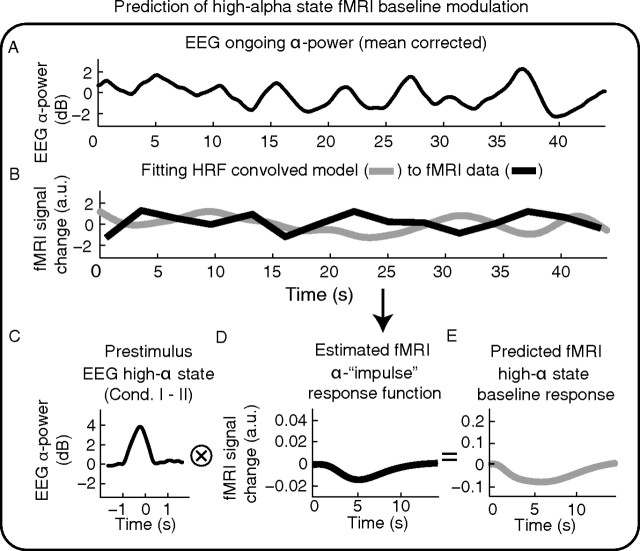
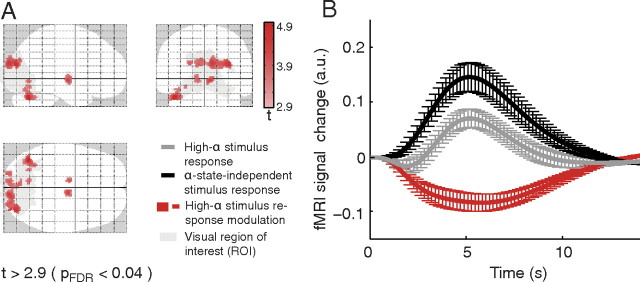
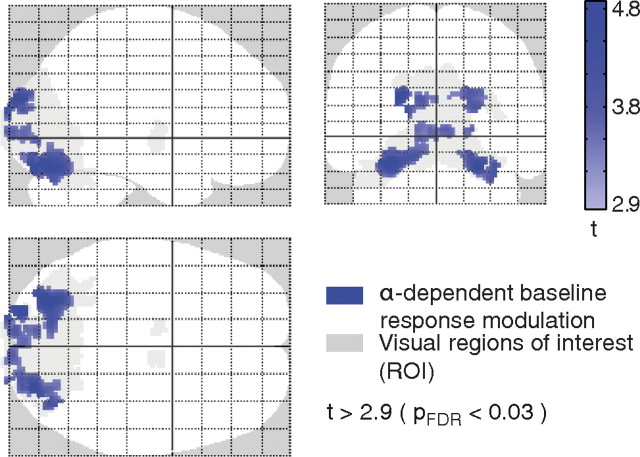
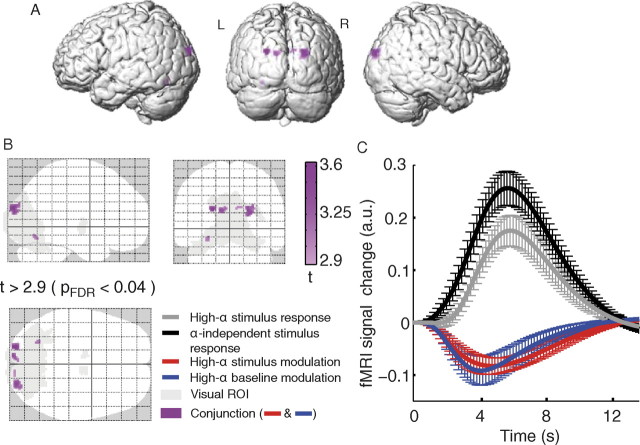
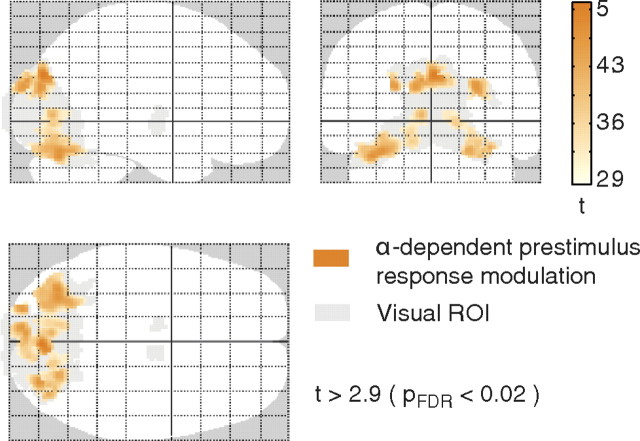
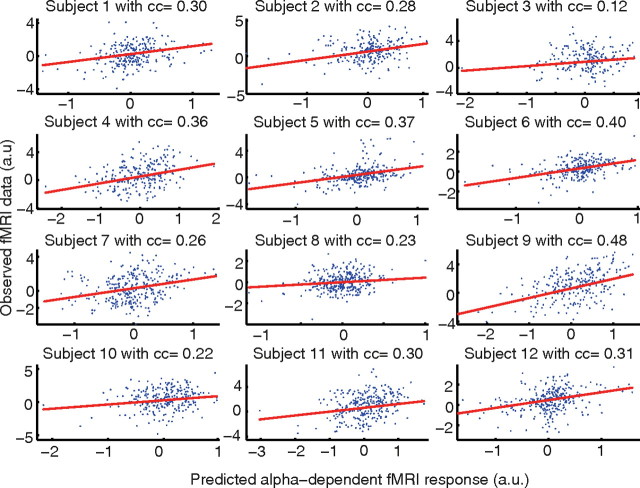
Variability of evoked single-trial responses despite constant input or task is a feature of large-scale brain signals recorded by fMRI. Initial evidence signified relevance of fMRI signal variability for perception and behavior. Yet the underlying intrinsic neuronal sources have not been previously substantiated. Here, we address this issue using simultaneous EEG-fMRI and real-time classification of ongoing alpha-rhythm states triggering visual stimulation in human subjects. We investigated whether spontaneous neuronal oscillations-as reflected in the posterior alpha rhythm-account for variability of evoked fMRI responses. Based on previous work, we specifically hypothesized linear superposition of fMRI activity related to fluctuations of ongoing alpha rhythm and a visually evoked fMRI response. We observed that spontaneous alpha-rhythm power fluctuations largely explain evoked fMRI response variance in extrastriate, thalamic, and cerebellar areas. For extrastriate areas, we confirmed the linear superposition hypothesis. We hence linked evoked fMRI response variability to an intrinsic rhythm's power fluctuations. These findings contribute to our conceptual understanding of how brain rhythms can account for trial-by-trial variability in stimulus processing.


Figures

Figure 1.
Figure 1.
Scheme of the experimental setup (left) and of the resulting model for analysis (right). A, First, IAAs were removed online. B, Then we used the demixing matrix obtained from the pre-experiment as a spatial filter. C, We extracted the posterior alpha-rhythm component and minimized signatures from other sources, such as heartbeat-related BCG. D, On these data, a short-term FFT was applied to calculate alpha-band power online. E, In the high alpha-state condition, stimulation was triggered when the current alpha-band power exceeded an adaptive threshold (condition I). F, Trigger timings from high alpha-state stimulation condition (condition I) were recorded and used for the state-independent stimulation condition (condition II). G, H, K–M, Model creation for fMRI analysis. Gray, Alpha power; green, final regressors. G, H, Calculation of stimulus regressor for conditions I (Regressor Ia) and II (Regressor IIa). Red, Unconvolved stick functions derived from stimulation. K, Calculation of prestimulus alpha power regressor for condition II (Regressor IIb). Thin dashed line, Parameterized alpha power stick function; orange, after mean correction. Final regressor (green) is orthogonal to Regressor IIa. Regressor IIb is thought to probe the effect of fluctuating prestimulus alpha activity on the evoked fMRI response. L, Calculation of ongoing alpha-power regressor (Regressor IIc). Thick dashed line, Ongoing alpha power convolved with HRF. Final regressor (green) is orthogonalized to Regressors IIa and IIb. Regressor IIc is supposed to probe stimulus-unrelated alpha activity, testing the effect of fluctuating alpha activity on the fMRI baseline. M, The model comprises additional regressors representing deviant stimuli, realignment parameters, and constant offsets.
Figure 2.
Figure 2.
Validation of the online EEG-triggered stimulation approach. All analyses are based on the alpha-associated IC. A, Left, Average posterior spatial distribution of alpha-associated IC. Right, Spatial distribution of alpha ICs for single subjects. Color bar represents weightings (arbitrary units). B, Grand average EPs of the alpha IC for high alpha-state and state-independent stimulations reproducing previously reported amplitude increases of a late evoked component for the high alpha-state stimulation condition (window of analysis in gray, p ≤ 0.05). C, Grand average time-frequency plots of EEG data for stimulation and interstimulus conditions demonstrate proper alpha state-dependent triggering. Top and middle rows, Images depict same data without (top) and with (middle) baseline correction. Bottom row, Significance of time-frequency behavior, tested against a prestimulus baseline. Decadic logarithmized p values are color coded (e.g., −2 indicates p < 10−2). Left column, High alpha-state stimulation; Middle column, state-independent stimulation; Right column, difference of time-frequency behavior between high alpha-state and state-independent stimulation conditions. Right column, middle row, Average prestimulus alpha-power increase (cf. Fig. 3). D, Validation of alpha-rhythm extraction and efficient BCG reduction. Grand averages of EEG alpha-band power of IAA-corrected data locked to either high alpha-state stimulation (black) or the heartbeat-related R peak (gray) before (left) and after (right) applying the spatial filter from the pre-experiment, extracting the alpha IC. Alpha rhythm is maintained in the alpha IC while BCG is strongly reduced. Note the different time scales for the two averages.
Figure 3.
Figure 3.
How we used observed alpha-dependent fMRI baseline modulations to predict high alpha-state fMRI baseline modulations. A, Ongoing alpha power (condition II). B, Regressor IIc (i.e., ongoing alpha power convolved with the canonical HRF+ derivatives, orthogonalized to Regressors IIa and IIb) is fitted to the data to estimate beta magnitudes. C, Prestimulus alpha power increase found in the high alpha condition relative to control condition (Fig. 2C). D, Estimation of the alpha-rhythm power impulse-response function by scaling HRF+ derivatives with the beta values obtained in B. With the generic hemodynamic impulse response function, we can predict an fMRI response to any arbitrary alpha-power behavior. E, We predicted fMRI responses to prestimulus high alpha-rhythm power signals by convolving the curves depicted in C and D. Resulting predictions were compared with the observed high alpha fMRI stimulus-response modulations (Fig. 6, blue and red curves).
Figure 4.
Figure 4.
fMRI results for alpha-dependent stimulus response modulation [t > 2.9; p < 0.04, FDR corrected (pFDR); extent threshold 10 voxels]. A, The observed deactivations (red) within the visual ROI (gray) are projected onto a glass brain template. For corresponding z-values and MNI coordinates with anatomical labeling, see Table 1. B, The resulting response curves for the identified clusters, depicting the high alpha-state stimulus response, the alpha-independent stimulus response, and their difference (error bars indicating SEM across subjects).
Figure 5.
Figure 5.
fMRI results for alpha-dependent baseline response modulation [t > 2.9; p < 0.03, FDR corrected (pFDR); extent threshold 10 voxels]. The observed deactivations (blue) within the visual ROI (gray) projected onto a glass brain template. For corresponding z-values and MNI coordinates with anatomical labeling, see Table 1.
Figure 6.
Figure 6.
fMRI results of conjunction analysis. A, B, Occipital and occipitoparietal clusters deactivating during high-alpha activity during both stimulation and nonstimulation periods [t > 2.9; p < 0.04, FDR corrected (pFDR); purple] depicted on a typical brain (Colin single-subject MNI brain template) and on a glass brain, together with the visual ROI (gray). C, In these areas, the observed difference in evoked fMRI responses due to high alpha stimulation (gray line) compared with state-independent stimulation (black line; difference depicted by red line) can be explained by the modulation of the fMRI baseline due to high alpha during nonstimulation periods (blue). Error bars indicate SEM across subjects. For corresponding z values and MNI coordinates with anatomical labeling, see Table 1.
Figure 7.
Figure 7.
A, Within the map of suprathreshold high alpha-state stimulus-response modulations, i.e., map red, two kinds of clusters can be identified. B, In one set of cortical areas (purple rings in A), the observed modulation during high alpha-state stimulation can be explained by baseline modulations caused by high alpha states (top). In the other set (black rings in A), including thalamic and cerebellar areas outside the conjunction map, the observed effect cannot be explained by baseline modulations (bottom).
Figure 8.
Figure 8.
fMRI results of single-trial prestimulus alpha correlation analysis, testing the effect of fluctuating prestimulus alpha power on the single-trial evoked fMRI response [t > 2.9; p < 0.02, FDR corrected (pFDR); extent threshold 10 voxels]. Found deactivations are depicted on a glass brain (orange; visual ROI, gray). For corresponding z values and MNI coordinates with anatomical labeling, see Table 1.
Figure 9.
Figure 9.
Single-trial correlation between prestimulus alpha power-based predictions of fMRI signal modulations (x-axis) and actually observed evoked fMRI responses (y-axis) for all individual subjects. The inverse relation between alpha power and fMRI signal is accounted for by model fitting. Hence the fitted model yields a positive correlation with the fMRI signal. A clear alpha dependency of the fMRI stimulus response across the entire continuum of prestimulus alpha power can be observed.

References

    1. Anami K, Mori T, Tanaka F, Kawagoe Y, Okamoto J, Yarita M, Ohnishi T, Yumoto M, Matsuda H, Saitoh O. Stepping stone sampling for retrieving artifact-free electroencephalogram during functional magnetic resonance imaging. Neuroimage. 2003;19:281–295. - PubMed
    1. Arieli A, Sterkin A, Grinvald A, Aertsen A. Dynamics of ongoing activity: explanation of the large variability in evoked cortical responses. Science. 1996;273:1868–1871. - PubMed
    1. Azouz R, Gray CM. Cellular mechanisms contributing to response variability of cortical neurons in vivo. J Neurosci. 1999;19:2209–2223. - PMC - PubMed
    1. Babiloni C, Brancucci A, Del Percio C, Capotosto P, Arendt-Nielsen L, Chen AC, Rossini PM. Anticipatory electroencephalography alpha rhythm predicts subjective perception of pain intensity. J Pain. 2006;7:709–717. - PubMed
    1. Becker R, Ritter P, Villringer A. Influence of ongoing alpha rhythm on the visual evoked potential. Neuroimage. 2008;39:707–716. - PubMed

Publication types

MeSH terms