. 2011 Jul 27;31(30):11028-38.
doi: 10.1523/JNEUROSCI.0193-11.2011.

Frequency-tuned cerebellar channels and burst-induced LTD lead to the cancellation of redundant sensory inputs

Affiliations

Frequency-tuned cerebellar channels and burst-induced LTD lead to the cancellation of redundant sensory inputs

Kieran Bol et al. J Neurosci. .

Abstract

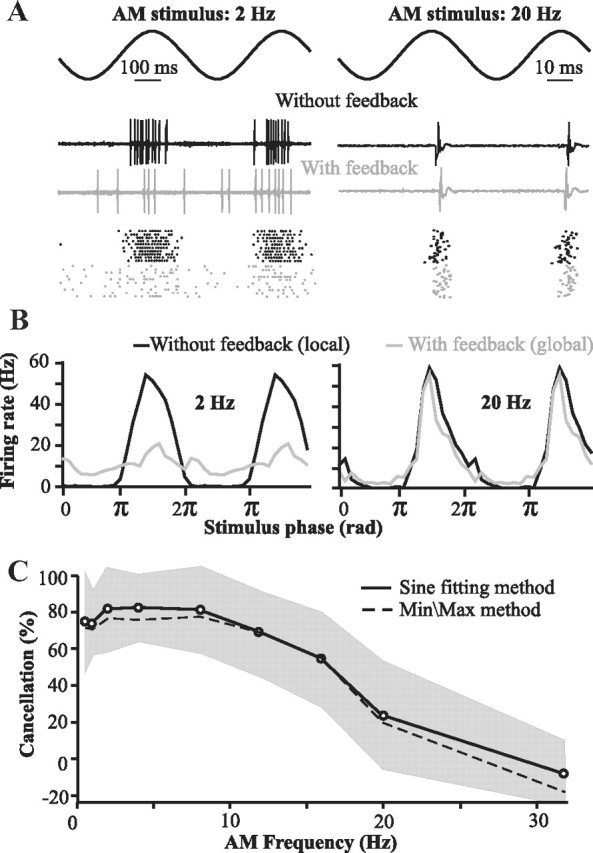
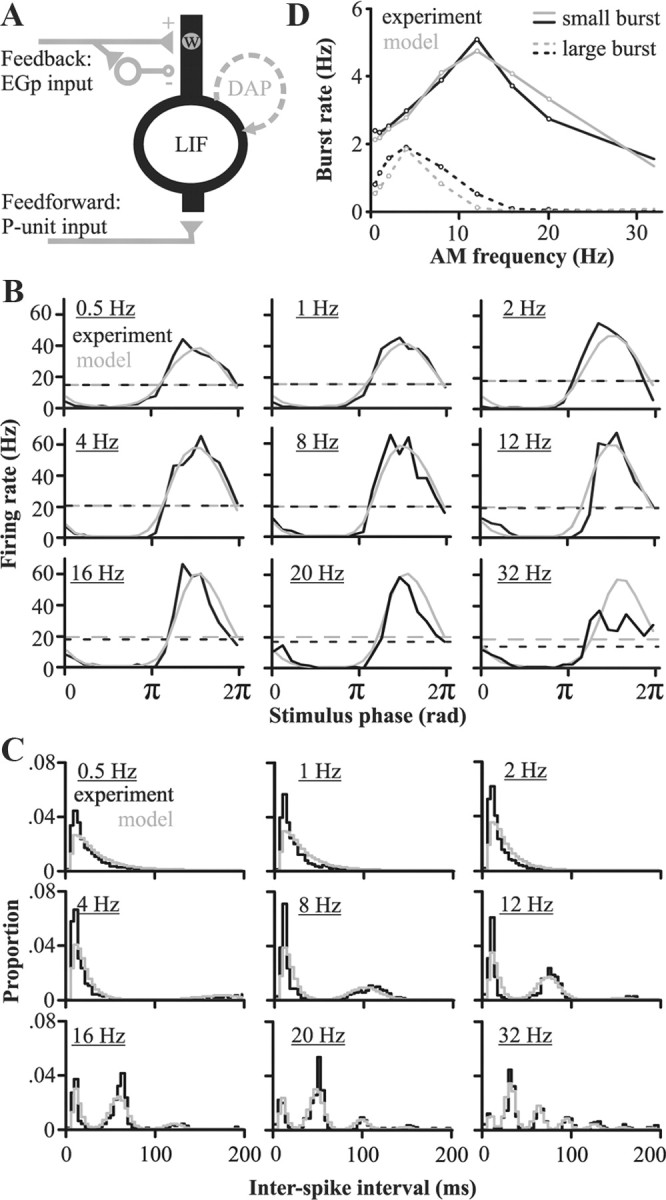
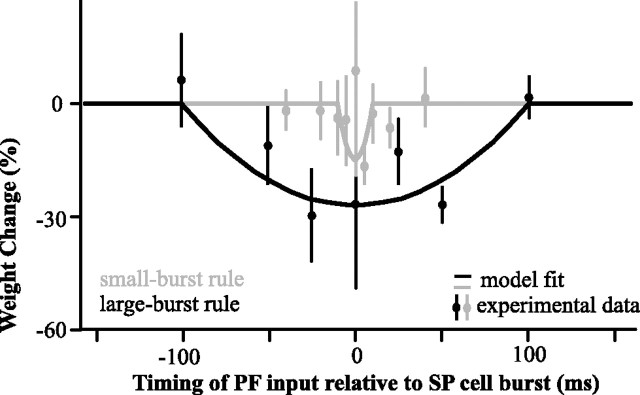
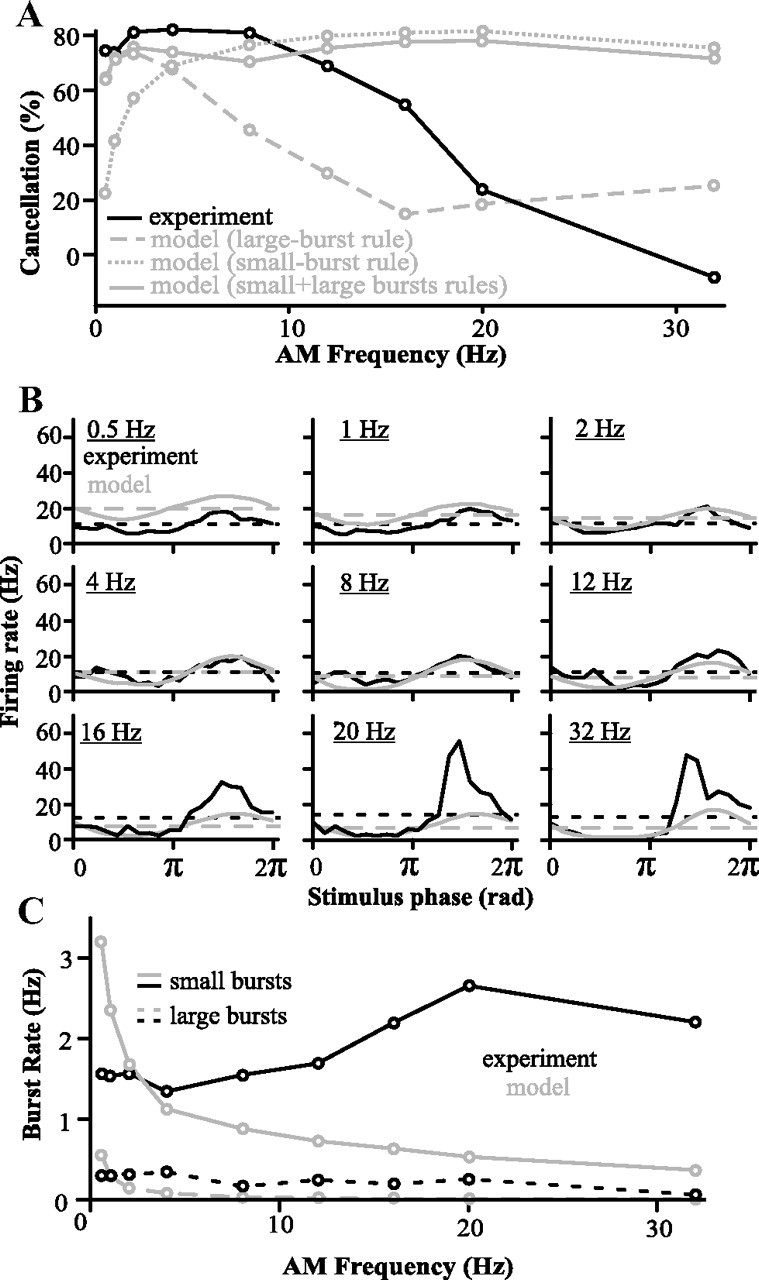
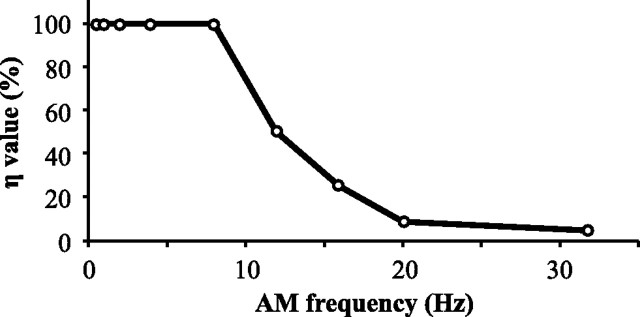
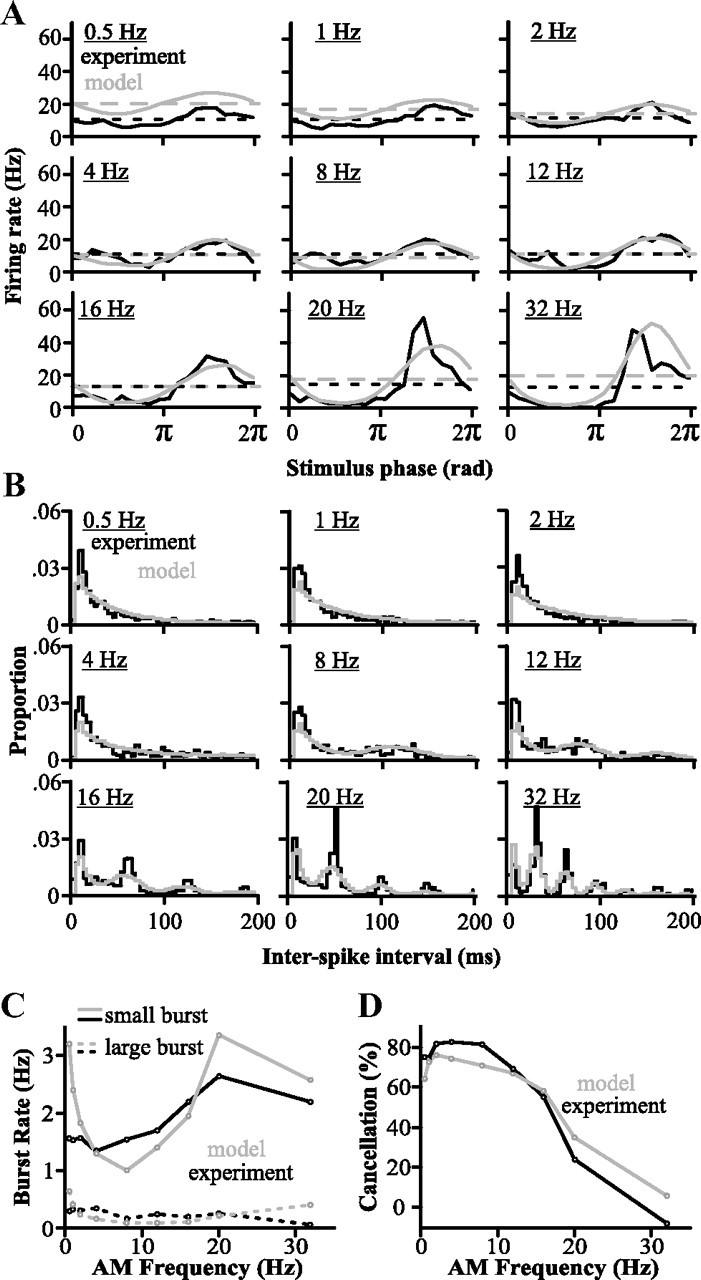
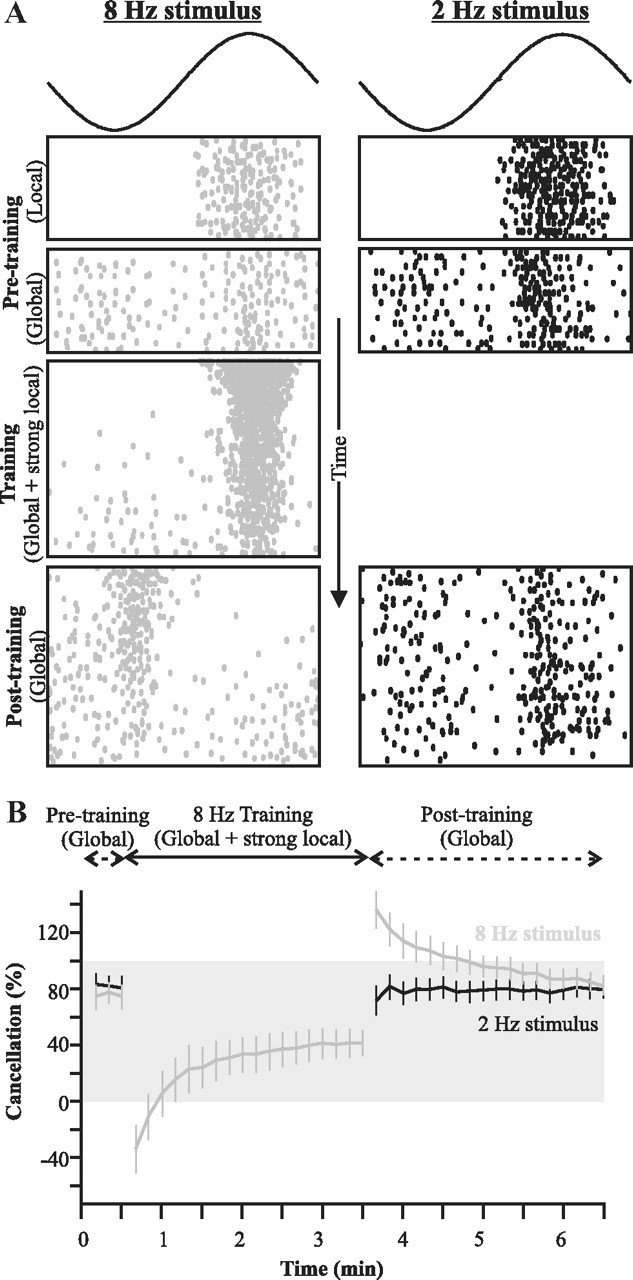
For optimal sensory processing, neural circuits must extract novel, unpredictable signals from the redundant sensory input in which they are embedded, but the detailed cellular and network mechanisms that implement such selective cancellation are presently unknown. Using a combination of modeling and experiment, we characterize in detail a cerebellar circuit in weakly electric fish, showing how it can carry out this computation. We use a model incorporating the wide range of experimentally estimated parallel fiber feedback delays and a burst-induced LTD rule derived from in vitro experiments to explain the precise cancellation of redundant signals observed in vivo. Our model demonstrates how the backpropagation-dependent burst dynamics adjusts the temporal pairing width of the plasticity mechanism to precisely match the frequency of the redundant signal. The model also makes the prediction that this cerebellar feedback pathway must be composed of frequency-tuned channels; this prediction is subsequently verified in vivo, highlighting a novel and general capability of cerebellar circuitry.


Figures

Figure 1.
Figure 1.
Properties of the system to be replicated by the model: local stimuli (no feedback) elicit a strong phase-locked response, whereas global stimuli—which do recruit the cerebellar feedback—elicit attenuated responses to low-frequency sine waves. This cancellation is due to feedback inputs. A, Examples of the responses of one neuron to sinusoidal stimuli of low or high frequencies (2 Hz or 20 Hz; top trace). The spike trains elicited by two cycles of the stimulus are displayed (middle traces) along with raster plots of the responses to many cycles (bottom plot). B, Average firing rate of superficial E-cells of the centrolateral segment of the ELL (n = 9 cells) elicited by one cycle of the stimulus (the data are duplicated on an adjacent cycle to improve visualization of the periodicity of the response). C, Cancellation of the stimulus response due to feedback as a function of stimulus frequency (mean ± SD; n = 9 cells). Cancellation is always calculated based on the ratio of the global PSTH's amplitude to the local PSTH's amplitude (see Materials and Methods). In the “Sine fitting method” (solid line), the PSTH's amplitude is calculated by fitting a sine wave (with the same frequency as the stimulus) through the mean firing rate data (e.g., see B). In the “Min/Max method,” the amplitude of the PSTH is the difference between its maximum (average of the highest 3 values) and minimum (average of the lowest 3 values). Both metrics achieve similar results; therefore, we use only the “sine fitting” method in subsequent graphs.
Figure 2.
Figure 2.
Model exploration: replication of pyramidal cells properties when stimulated locally (no feedback) and constraints imposed on the model during global stimulation (with feedback). A, Schematic of the main components of the model: an LIF model cell receiving feedforward input from the receptors and feedback inputs from the EGp. A DAP was added to replicate the neuron's burst propensity. The feedback inputs have a direct excitatory component delivered through plastic synapses (of weight w) and a disynaptic nonplastic inhibitory component. This feedback input is active only when modeling the response to global stimuli. B, Peristimulus time histograms comparing the response of in vivo (n = 9 cells) and modeled pyramidal cells elicited by local stimuli of different AM frequencies. Dashed lines represent the average firing rate. C, Interspike interval histograms of the model's responses and for experimental data (n = 9 cells) for AM rates ranging from 0.5 to 32 Hz. Bin width is 4 ms. Although ISIs >200 ms do occur, they are rare, and the histogram's area is normalized to 1 for ISIs <200 ms. D, Comparison of in vivo and modeled pyramidal cell responses (n = 9 cells) during local stimulation: burst rates as a function of stimulus frequency. Bursting is quantified by dividing the spike trains into small (2 or 3 spikes) or large bursts (4 or 5 spikes); longer bursts are taken as combinations of small and large bursts (see Materials and Methods).
Figure 3.
Figure 3.
Burst-induced depression measured in vitro (data points; mean ± SE, n = 7 cells for all points except for 100 ms, where n = 5) and applied to the PF–SP synapse of the model (lines) for small bursts and large bursts (gray and black respectively). The measured weight change is the result of 100 presynaptic and postsynaptic burst pairings. Note that the large-burst rule is not equal to the sum of two small-burst rules. Depression was induced in vitro by repeatedly pairing burst-like electrical stimulations to the PF and burst-like current injection in the SP cell's soma. The size of the EPSP elicited in the pyramidal cell by a test stimulation of the PF was then measured as the time lag between PF and SP burst stimulation was varied (see Harvey-Girard et al., 2010 for more details).
Figure 4.
Figure 4.
Comparisons between model and experimental responses when the model learned with the large-burst rule, the small-burst rule, or both. Note that, in this figure, parallel fiber activity is as yet unconstrained (compare to Fig. 6). A, Cancellation performance of the model compared to experimental data (n = 9 cells) (see Fig. 1). B, PSTH of the model and in vivo responses (global stimuli; n = 9 cells) when both large and small burst rule are used while the model is learning. Dashed lines represent average firing rate per second. C, Burst rates in model and in vivo responses (n = 9 cells) when both large and small burst rule are used while the model is learning. Note the difference in small burst rate at high AM frequencies.
Figure 5.
Figure 5.
Frequency dependence of learning. The decreasing propensity for granule cells to burst at higher frequencies is implemented by changing the learning rule strength η. For each stimulus frequency, we determined the value of η that resulted in an optimal fit between model and experimental results. We plot here η as a percentage of the original values (0.0036 and 0.0018 for large- and small-burst rules respectively) (see Table 1).
Figure 6.
Figure 6.
Comparison of the model with in vivo data showing its ability to replicate the feedback-induced cancellation. This model now includes the frequency dependence of granule cell bursting. A, PSTH of the model and in vivo responses to global stimuli of different frequencies (n = 9 cells). Dashed lines represent average firing rate per second. B, Interspike interval histogram of the model's responses and for experimental data (n = 9 cells). Bin width is 4 ms. C, Burst rates in model and in vivo responses (n = 9 cells). Bursting responses were segregated into small and large bursts as described previously (see also Materials and Methods). D, Cancellation measured for responses of this final version of the model correspond well to the in vivo data (n = 9 cells).
Figure 7.
Figure 7.
Frequency-specificity of parallel fiber inputs demonstrated in vivo. A, Raster plot showing, as a function of time, the response of a typical cell to the different steps of the experimental protocol: pretraining baseline for two AM frequencies delivered either locally (no feedback) or globally (thus recruiting feedback); training stimuli of a single frequency where a local stimulus is added to a global one; and posttraining responses to global stimuli revealing the effect of the induced plasticity on the response to the two frequencies. B, Quantification of the mean (±SE; n = 11 cells) canceling impact of the feedback. The gray shading highlights values of cancellation between 0 and 100%. Values below zero mean that the response is more strongly modulated by the stimulus than the uncanceled baseline (local stimulation), and thus that the response is not canceled but enhanced. Values above 100 indicate an overcancellation: cancellation is perfect (100%) when the response is flat across phases. But if the canceling feedback is too strong, the neuron will respond more strongly at the trough of the cycle than at the top (see Materials and Methods for details).

Similar articles

Cited by

References

    1. Albus S. A theory of cerebellar function. Math Biosci. 1971;10:25–61.
    1. Bastian J. Gain-control in the electrosensory system mediated by descending inputs to the electrosensory lateral line lobe. J Neurosci. 1986;6:553–562. - PMC - PubMed
    1. Bastian J, Bratton B. Descending control of electroreception. 1. Properties of nucleus-praeeminentialis neurons projecting indirectly to the electrosensory lateral line lobe. J Neurosci. 1990;10:1226–1240. - PMC - PubMed
    1. Bastian J, Nguyenkim J. Dendritic modulation of burst-like firing in sensory neurons. J Neurophysiol. 2001;85:10–22. - PubMed
    1. Bastian J, Chacron MJ, Maler L. Plastic and nonplastic pyramidal cells perform unique roles in a network capable of adaptive redundancy reduction. Neuron. 2004;41:767–779. - PubMed

Publication types

LinkOut - more resources