Randomized Controlled Trial
. 2011 Jul 27;31(30):11044-54.
doi: 10.1523/JNEUROSCI.2125-11.2011.

Repetitive transcranial magnetic stimulation enhances BDNF-TrkB signaling in both brain and lymphocyte

Affiliations
Randomized Controlled Trial

Repetitive transcranial magnetic stimulation enhances BDNF-TrkB signaling in both brain and lymphocyte

Hoau-Yan Wang et al. J Neurosci. .

Abstract

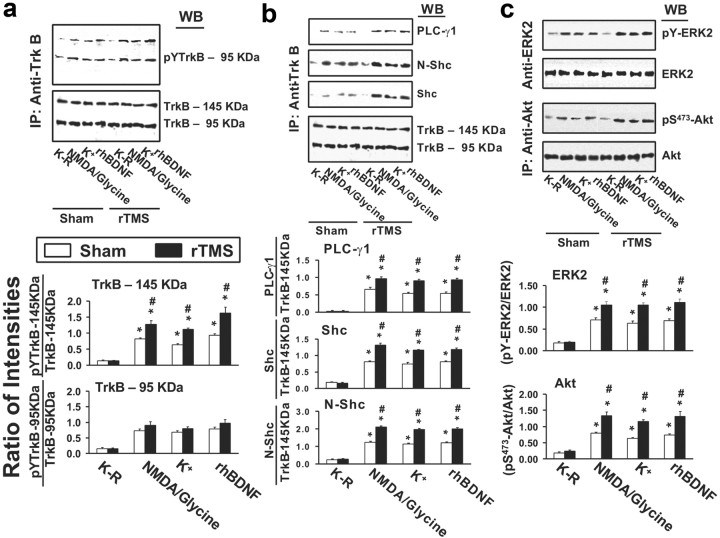
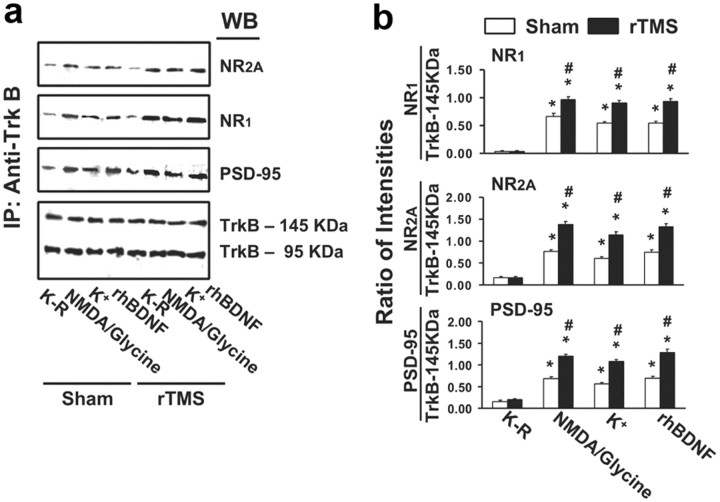
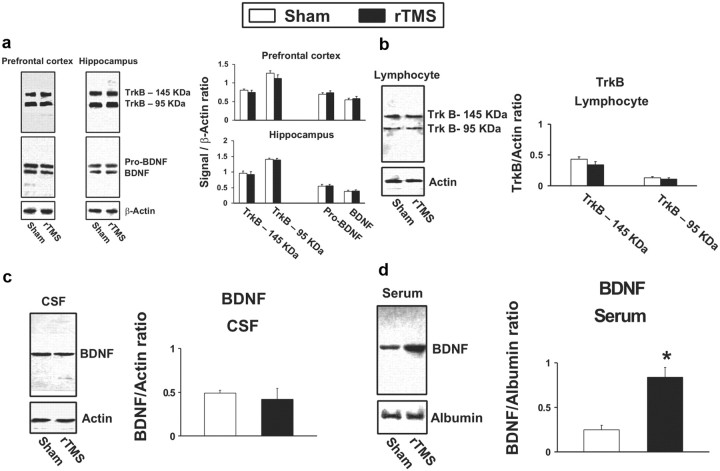
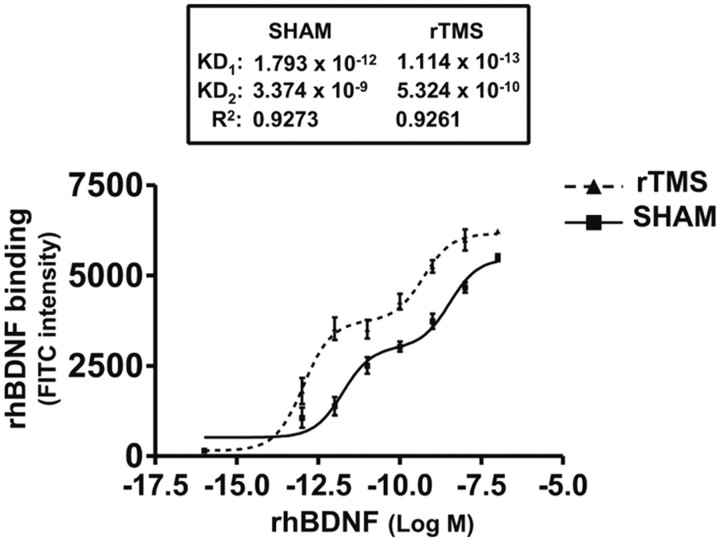
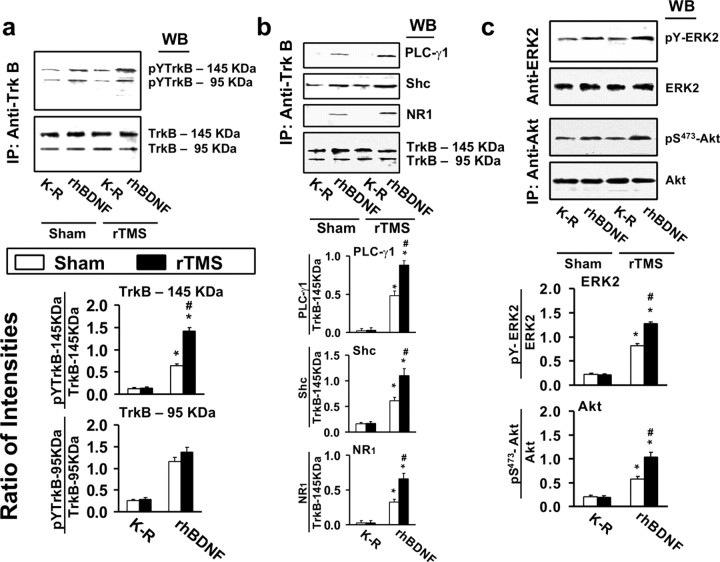
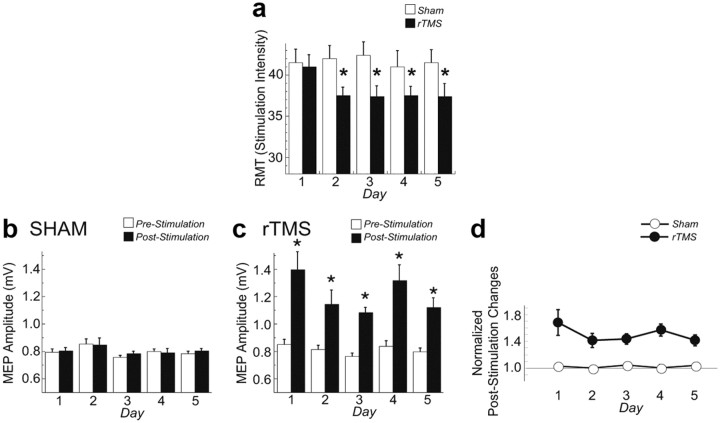
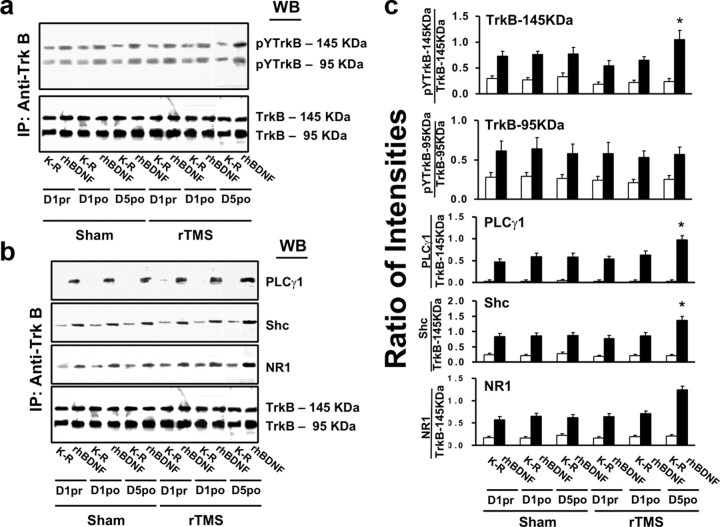
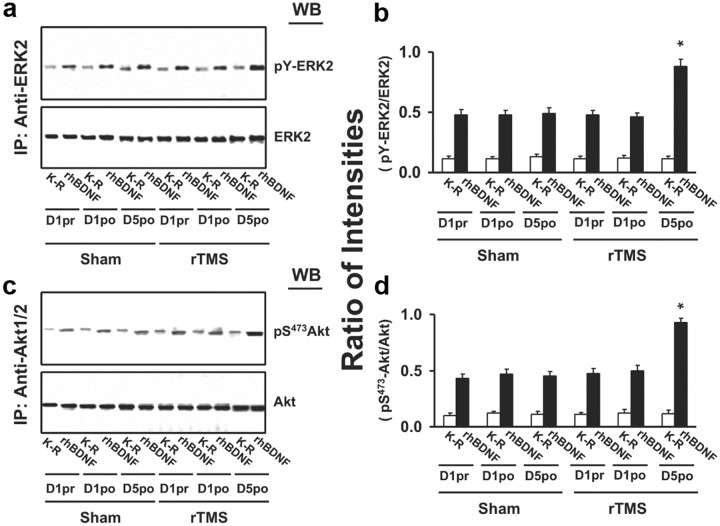
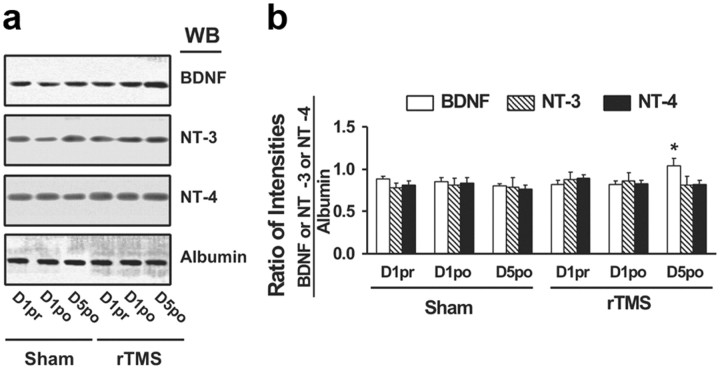
Repetitive transcranial magnetic stimulation (rTMS) induces neuronal long-term potentiation or depression. Although brain-derived neurotrophic factor (BDNF) and its cognate tyrosine receptor kinase B (TrkB) contribute to the effects of rTMS, their precise role and underlying mechanism remain poorly understood. Here we show that daily 5 Hz rTMS for 5 d improves BDNF-TrkB signaling in rats by increasing the affinity of BDNF for TrkB, which results in higher tyrosine-phosphorylated TrkB, increased recruitment of PLC-γ1 and shc/N-shc to TrkB, and heightened downstream ERK2 and PI-3K activities in prefrontal cortex and in lymphocytes. The elevated BDNF-TrkB signaling is accompanied by an increased association between the activated TrkB and NMDA receptor (NMDAR). In normal human subjects, 5 d rTMS to motor cortex decreased resting motor threshold, which correlates with heightened BDNF-TrkB signaling and intensified TrkB-NMDAR association in lymphocytes. These findings suggest that rTMS to cortex facilitates BDNF-TrkB-NMDAR functioning in both cortex and lymphocytes.


Figures

Figure 1.
Figure 1.
rTMS treatments increase BDNF–TrkB signaling in prefrontal cortex. a–c, Representative blots (top) with normalized densitometric data (bottom) showing the Western analysis of the effect of 5 d rTMS on tyrosine-phosphorylated (pY) TrkB levels (a); the levels of PLCγ1 and adaptor proteins, shc and N-shc, recruited to TrkB (b); and the levels of activated ERK2 (pY-ERK2) and phosphorylated Akt (pS473-Akt) (c) in response to exogenously added rhBDNF or endogenously released BDNF by K+-depolarization or 10 μm NMDA + 1 μm glycine in the anti-TrkB (a, b) and -ERK2 or Akt (c) immunoprecipitates of prefrontal cortical slice lysates prepared from sham-treated or 5 d rTMS rats. The blots were stripped and reprobed with anti-TrkB (a, b) and -ERK2 or Akt (c) to measure immunoprecipitation efficiency and loading. The densitometric quantification was done on six sham control/rTMS pairs. Data are means ± SEM of ratio of the optical intensity of the pY-TrkB (a) or PLCγ1, Shc, or N-shc (b) to the TrkB band or the pY-ERK2 (c) and pS473-Akt (c) to the ERK2 and Akt, respectively, derived from six independent determinations. *p < 0.01 compared to respective Krebs'–Ringer-treated level in the same group. #p < 0.01 compared to respective response in the sham control group.
Figure 2.
Figure 2.
rTMS treatments increase BDNF-induced association of the NMDARs and NMDAR synaptic anchoring protein PSD-95 with TrkB in prefrontal cortex. a, b, A representative blot (a) and normalized densitometric data (b) showing the Western analysis of the effect of 5 d rTMS on the levels of NMDAR subunits NR1 and NR2A as well as NMDAR synaptic anchoring protein PSD-95 associated with TrkB in response to exogenously added rhBDNF or endogenously release BDNF by K+-depolarization or 10 μm NMDA + 1 μm glycine in the anti-TrkB immunoprecipitates of prefrontal cortical slice lysates prepared from sham-treated or 5 d rTMS rats. The blots were stripped and reprobed with anti-TrkB to measure immunoprecipitation efficiency and loading. The data are means ± SEM of ratio of the optical intensity of the NR1, NR2A, and PSD-95 to the TrkB-145 kDa band derived from six independent determinations. *p < 0.01 compared to respective K–R-treated level in the same group. #p < 0.01 compared to respective response in the sham control group.
Figure 3.
Figure 3.
The effect of rTMS treatments on TrkB and pro-BDNF/BDNF expression levels. a–d, Representative blots (left) with normalized densitometric data (right) showing the Western analysis of the effect of 5 d rTMS on the expression levels of 145 and 95 kDa TrkB, pro-BDNF (32 kDa), and BDNF (14 kDa) in PFCX and hippocampus (a); the expression levels of 145 and 95 kDa TrkB in lymphocytes (b); and the expression level of BDNF in CSF (c) and in plasma (d).
Figure 4.
Figure 4.
rTMS treatments increase BDNF affinity to TrkB in prefrontal cortex. The effect of 5 d rTMS on the interaction of BDNF with TrkB was assessed by a ligand binding assay. The membrane-bound proteins were first biotinylated using a biotinylation kit. Following detergent solubilization and then dilution, the biotinylated surface proteins were coated onto streptavidin-coated plates (Reacti-Bind NeutrAvidin high binding capacity coated 96-well plate). Plates were washed and incubated at 30°C with K–R, and BDNF (100 fm to 10 nm) was added for 1 h. The plate was washed and then sequentially incubated with anti-BDNF followed by FITC-conjugated anti-rabbit IgG. Plates were washed and the residual FITC signals were determined by a multimode plate reader, DTX880 (Beckman). Nonlinear regression data curve fit was performed using Prism. Data points are means and vertical bars are the SEM derived from six independent rats in each treatment group.
Figure 5.
Figure 5.
rTMS treatments increase BDNF–TrkB signaling and TrkB–NMDAR interaction in lymphocytes. a–c, Representative blots (top) with normalized densitometric data (bottom) showing the Western analysis of the effect of 5 d rTMS on tyrosine-phosphorylated (pY) TrkB levels (a); the levels of PLCγ1, adaptor protein shc, and NMDAR-NR1 subunit recruited to TrkB (b); and the levels of activated ERK2 (pY-ERK2) and phosphorylated Akt (pS473-Akt) (c) in response to exogenously added rhBDNF in the anti-TrkB (a, b) and -ERK2 or Akt (c) immunoprecipitates of lymphocyte lysates prepared from sham-treated or 5 d rTMS rats. The blots were stripped and reprobed with anti-TrkB (a, b) and -ERK2 or Akt (c) to measure immunoprecipitation efficiency and loading. The densitometric quantification was done on six sham control/rTMS pairs. Data are means ± SEM of the ratio of the optical intensity of the pY-TrkB (a) or PLCγ1, Shc, or NR1 (b) to the TrkB band or the pY-ERK2 (c) and pS473-Akt (c) to the ERK2 and Akt, respectively, derived from six independent determinations. *p < 0.01 compared to respective Krebs'–Ringer-treated level in the same group. #p < 0.01 compared to respective response in the sham control group.
Figure 6.
Figure 6.
The effects of rTMS on RMT and on the amplitude of MEP. a, RMT is plotted as a function of day for the rTMS and sham treatment. RMT significantly decreased in the rTMS but not in the sham session starting from the second day of treatment. The asterisk indicates significant differences (p < 0.005) with a post hoc test. b, c, Mean MEP amplitude before and immediately after sham (b) and rTMS (c) are plotted as a function of day. MEP amplitude significantly increased only after each rTMS treatment (asterisks: p < 0.0001). d, The poststimulation changes (computed as the pre–post stimulation MEP differences normalized by the pre-MEP amplitude for each day) did not differ across days (p > 0.1) for either sham or rTMS treatment.
Figure 7.
Figure 7.
rTMS treatments increase BDNF–TrkB signaling and TrkB–NMDAR interaction in lymphocytes from healthy human subjects. a–c, Representative blots (a, b) with normalized densitometric data (c) showing the Western analysis of the effect of rTMS on tyrosine-phosphorylated (pY) TrkB levels (a) and the levels of PLCγ1 and adaptor protein shc and NMDAR-NR1 subunit (b) recruited to TrkB in response to exogenously added rhBDNF in the anti-TrkB immunoprecipitates of lymphocyte lysates. Lymphocytes were prepared from blood drawn from human volunteers 1 d prior to (1pr) or after (1po) and 5 d after (5po) sham/rTMS treatments. The blots were stripped and reprobed with anti-TrkB to measure immunoprecipitation efficiency and loading. The densitometric quantification was done on five subjects who completed all sham and rTMS sessions. Data are means ± SEM of the ratio of the optical intensity of the pY-TrkB, PLCγ1, Shc, or NR1 to the TrkB band. *p < 0.01 compared to respective response in the sham control group.
Figure 8.
Figure 8.
rTMS treatments increase TrkB downstream ERK2 and Akt activation in lymphocytes from healthy human subjects. A representative blot (a, b) with normalized densitometric data (c, d) showing the Western analysis of the effect of rTMS on the levels of pY-ERK2 and pS473-Akt in response to exogenously added rhBDNF in the anti-ERK2 and -Akt immunoprecipitates of lymphocyte lysates. Lymphocytes were prepared from blood drawn from human volunteers 1 d prior to (1pr) or after (1po) and 5 d after (5po) sham/rTMS treatments. The blots were stripped and reprobed with anti-ERK2 or -Akt to measure immunoprecipitation efficiency and loading. The densitometric quantification was done on five subjects who completed all sham and rTMS sessions. Data are means ± SEM of ratio of the optical intensity of the pY-ERK2 and pS473-Akt to the ERK2 and Akt band, respectively. *p < 0.01 compared to respective response in the sham control group.
Figure 9.
Figure 9.
The effect of rTMS treatments on the expression levels of BDNF, NT-3, and NT-4 in sera from healthy human subjects. a. A representative blot showing the Western analysis of the effect of sham and rTMS treatments on BDNF, NT-3, NT-4, and albumin levels in sera prepared from blood drawn from human volunteers on 1 d prior to (1pr) or after (1po) and 5 d after (5po) treatments. b. Normalized densitometric quantification data with albumin showing the effect of sham and rTMS treatments on BDNF, NT-3, and NT-4 levels in sera. The densitometric quantification was done on five subjects who completed all sham and rTMS sessions. Data are means ± SEM of the ratio of the optical intensities of the BDNF, NT-3, or NT-4 to the albumin band. *p < 0.01 versus respective level in each of three conditions (1pr, 1po, or 5po) in the sham control group by a two-tailed Student's t test.

References

    1. Akopian G, Crawford C, Beal MF, Cappelletti M, Jakowec MW, Petzinger GM, Zheng L, Gheorghe SL, Reichel CM, Chow R, Walsh JP. Decreased striatal dopamine release underlies increased expression of long-term synaptic potentiation at corticostriatal synapses 24 h after 3-nitropropionic-acid-induced chemical hypoxia. J Neurosci. 2008;28:9585–9597. - PMC - PubMed
    1. Berzi A, Ayata CK, Cavalcante P, Falcone C, Candiago E, Motta T, Bernasconi P, Hohlfeld R, Mantegazza R, Meinl E, Farina C. BDNF and its receptors in human myasthenic thymus: implications for cell fate in thymic pathology. J Neuroimmunol. 2008;197:128–139. - PubMed
    1. Conte A, Belvisi D, Iezzi E, Mari F, Inghilleri M, Berardelli A. Effects of attention on inhibitory and facilitatory phenomena elicited by paired-pulse transcranial magnetic stimulation in healthy subjects. Exp Brain Res. 2008;186:393–399. - PubMed
    1. Derecki NC, Cardani AN, Yang CH, Quinnies KM, Crihfield A, Lynch KR, Kipnis J. Regulation of learning and memory by meningeal immunity: a key role for IL-4. J Exp Med. 2010;207:1067–1080. - PMC - PubMed
    1. De Santi L, Cantalupo L, Tassi M, Raspadori D, Cioni C, Annunziata P. Higher expression of BDNF receptor gp145trkB is associated with lower apoptosis intensity in T cell lines in multiple sclerosis. J Neurol Sci. 2009;277:65–70. - PubMed

Publication types

MeSH terms

Substances