. 2011 Jul 27;31(30):11055-69.
doi: 10.1523/JNEUROSCI.0479-11.2011.

Ascl1 genetics reveals insights into cerebellum local circuit assembly

Affiliations

Ascl1 genetics reveals insights into cerebellum local circuit assembly

Anamaria Sudarov et al. J Neurosci. .

Abstract

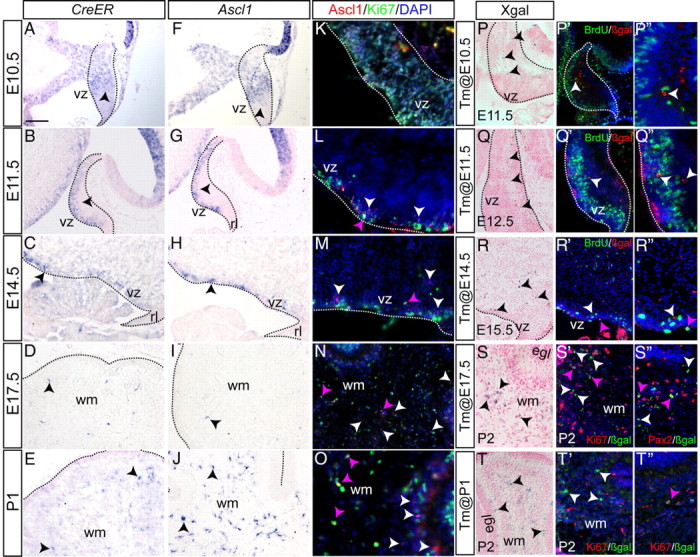
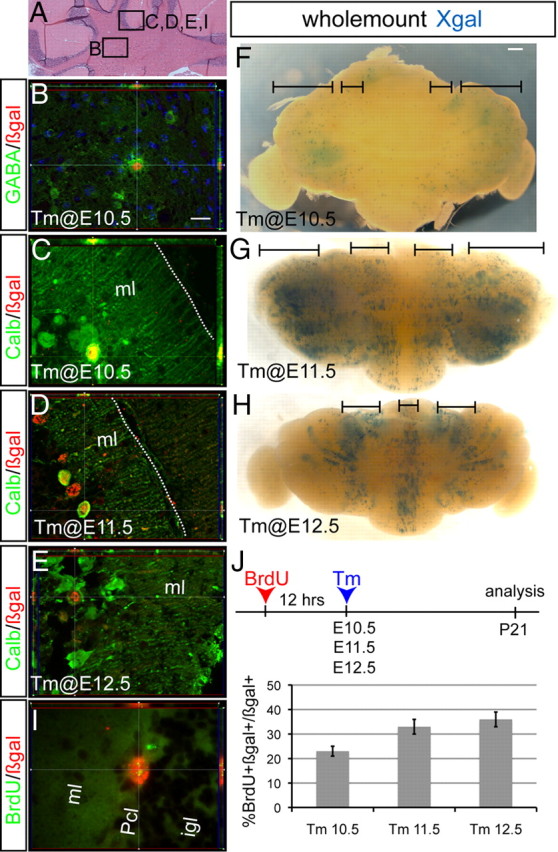
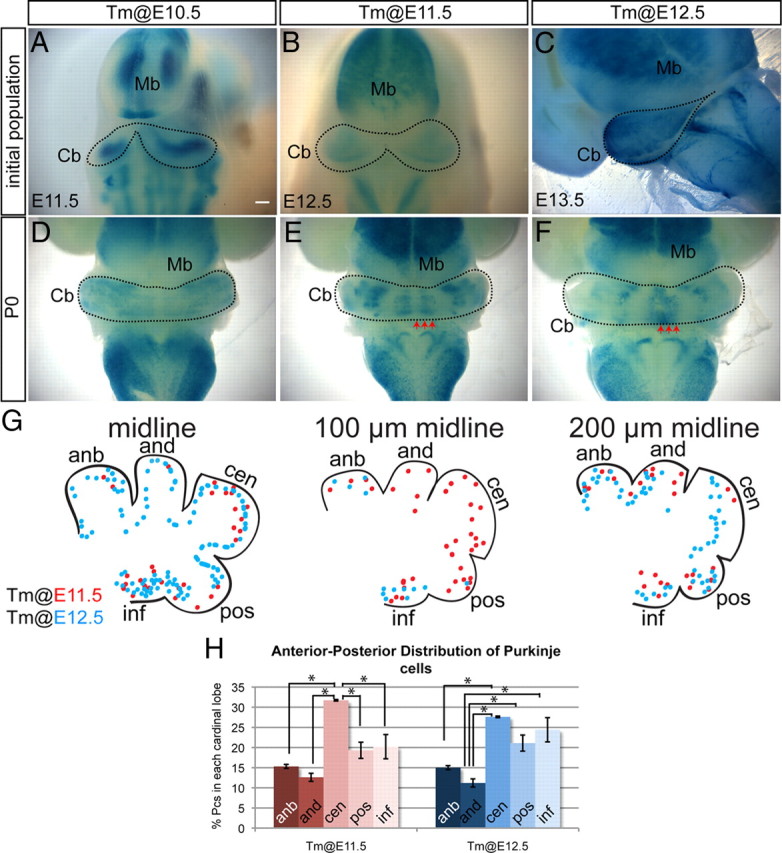
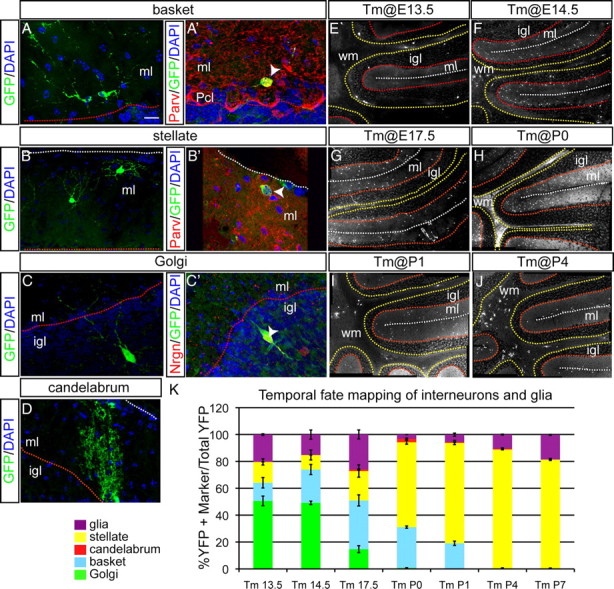
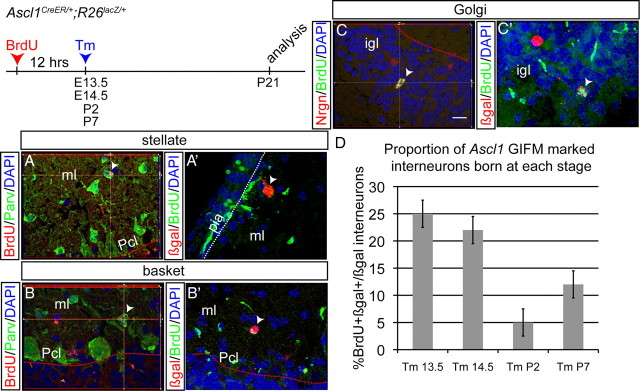
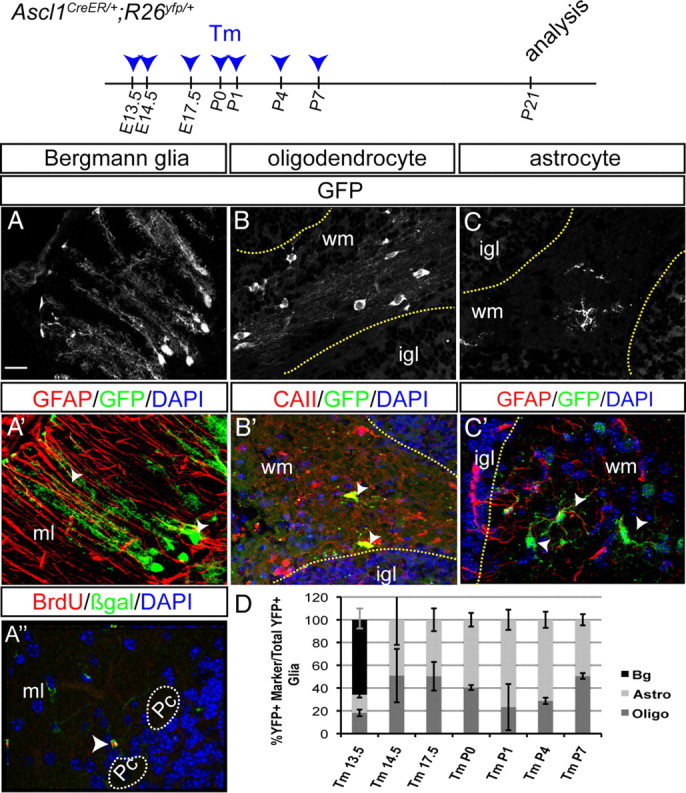
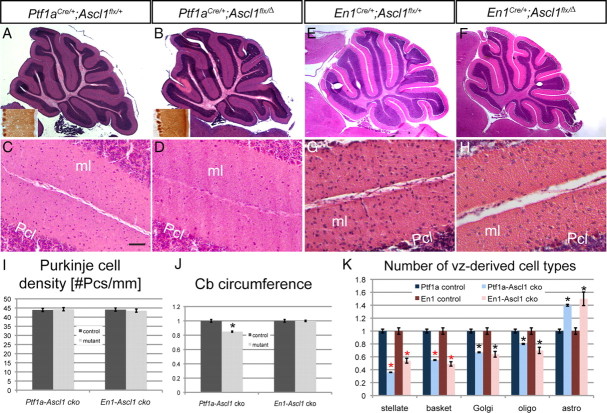
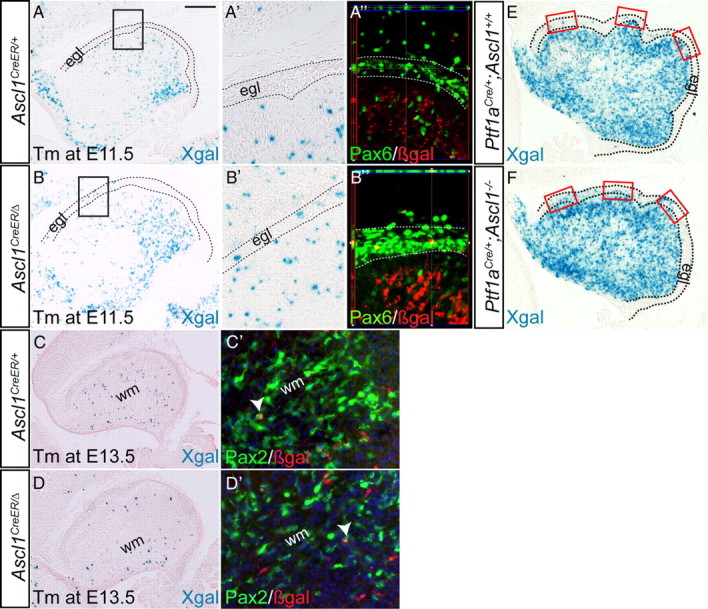
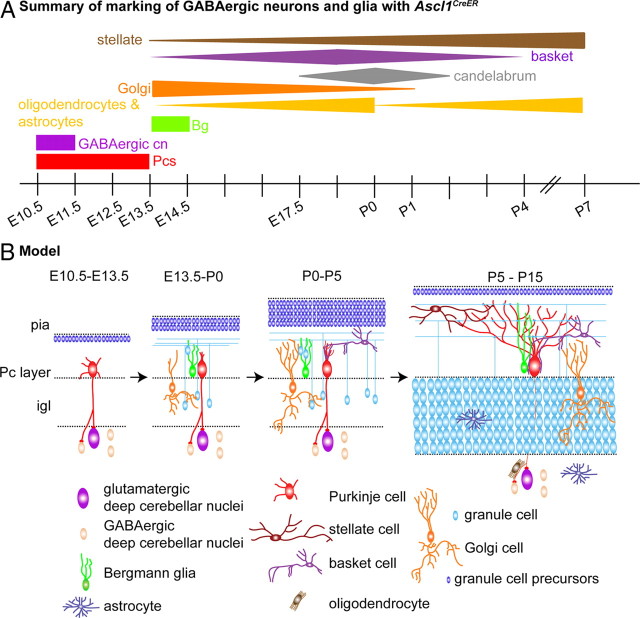
Two recently generated targeted mouse alleles of the neurogenic gene Ascl1 were used to characterize cerebellum circuit formation. First, genetic inducible fate mapping (GIFM) with an Ascl1(CreER) allele was found to specifically mark all glial and neuron cell types that arise from the ventricular zone (vz). Moreover, each cell type has a unique temporal profile of marking with Ascl1(CreER) GIFM. Of great utility, Purkinje cells (Pcs), an early cohort of Bergmann glia, and four classes of GABAergic interneurons can be genetically birth dated during embryogenesis using Ascl1(CreER) GIFM. Astrocytes and oligodendrocytes, in contrast, express Ascl1(CreER) throughout their proliferative phase in the white matter. Interestingly, the final position each neuron type acquires differs depending on when it expresses Ascl1. Interneurons (including candelabrum) attain a more outside position the later they express Ascl1, whereas Pcs have distinct settling patterns each day they express Ascl1. Second, using a conditional Ascl1 allele, we discovered that Ascl1 is differentially required for generation of most vz-derived cells. Mice lacking Ascl1 in the cerebellum have a major decrease in three types of interneurons with a tendency toward a loss of later-born interneurons, as well as an imbalance of oligodendrocytes and astrocytes. Double-mutant analysis indicates that a related helix-loop-helix protein, Ptf1a, functions with Ascl1 in generating interneurons and Pcs. By fate mapping vz-derived cells in Ascl1 mutants, we further discovered that Ascl1 plays a specific role during the time period when Pcs are generated in restricting vz progenitors from becoming rhombic lip progenitors.


Figures

Figure 1.
Figure 1.
The Ascl1CreER allele is expressed similar to Ascl1 and primarily marks cells that rapidly stop dividing. CreER expression (A–E) closely resembles endogenous Ascl1 expression (F–J) in the cerebellum (outline) throughout embryogenesis. K–O, Ascl1-expressing cells have distinct proliferative characteristics at various time points. P–T″, Ascl1CreER/+;R262RlacZ/+ animals were given Tm at different time points and killed 24 h later. One hour BrdU pulse was given to Ascl1CreER/+;R262RlacZ/+ animals before killing. P, Tm was administered at E10.5, and sagittal sections of E11.5 embryos were analyzed by Xgal staining. Xgal+ cells were found away from the vz. P′, Double-labeling immunohistochemistry for BrdU and βgal shows BrdU (green) in the vz, whereas Ascl1CreER GIFM-marked cells were BrdU negative. P″, Higher magnification of P′. Same type of analysis was performed for Tm administration at E11.5 (Q–Q″) and E14.5 (R–R″). Few Ascl1CreER GIFM-marked cells incorporated BrdU (pink arrows) when Tm was administered at E14.5 (R′, R″). S′, When Tm was administered at E17.5 and the cerebellum analyzed at P2, few cells were Ki67+ (pink arrows). S″, The majority of βgal+ cells were Pax2+ (pink arrowheads). T′, T″, When Tm was administered at P1, very few of the fate-mapped cells were Ki67+ (pink arrow). rl, Rhombic lip. Scale bar: A–P′, Q, Q′, S–T″, 50 μm; P″, Q″, R″, 30 μm.
Figure 2.
Figure 2.
GABAergic cn interneurons and Purkinje cells are the first cell types marked by Ascl1CreER GIFM. A, Coronal section of the adult cerebellum highlighting where images in B–E and I were taken. B, Double-labeling immunohistochemistry for GABA (green) and βgal (red) shows that cn interneurons were marked when Tm was administered at E10.5. Anti-calbindin (green) and anti-βgal (red) double-labeling immunohistochemistry shows that fate-mapped cells are Purkinje cells when Tm was administered at E10.5 (C), E11.5 (D), and E12.5 (E). F–H, Dorsal views of whole-mount Xgal staining of P21 cerebella when Tm was administered at E10.5 (F), E11.5 (G), and E12.5 (H). I, BrdU was administered 12 h before Tm administration at E10.5, E11.5, or E12.5 and analysis performed at P21. Double-labeling immunohistochemistry for βgal (red) and BrdU (green) shows that Ascl1CreER GIFM-marked Pcs retained BrdU labeling. J, Quantification of the number of double-positive BrdU and βgal Pcs (mean ± SEM; n = 3; unpaired t test). Pcl, Purkinje cell layer. Scale bar: A, 100 μm; B–E, I, 20 μm; F–H, 600 μm.
Figure 3.
Figure 3.
Purkinje cells marked with Ascl1CreER GIFM on consecutive days settle in distinct M-L and A-P patterns. A–C, Whole-mount Xgal staining of embryos 24 h after Tm administration. A, E11.5 whole-mount Xgal staining of Pcs marked at E10.5 reveals that Pcs were uniformly labeled in the lateral cerebellar primordium. B, At E12.5, whole-mount Xgal staining of Pcs marked at E11.5 shows labeling of Pcs in the cerebellar primordium excluding the midline. C, E13.5 whole-mount Xgal staining of Pcs marked at E12.5 reveals that Pcs were uniformly labeled throughout the M-L axis of the cerebellum. D, P0 whole-mount Xgal staining of Pcs marked at E10.5 shows that Pcs were found throughout the cerebellum except the midline. E, P0 whole-mount Xgal staining of Pcs marked at E11.5 depicts four pairs of distinct M-L Pc bands. F, P0 whole-mount Xgal staining of Pcs marked at E12.5 shows a single midline Pc band and two bilateral clusters in the paravermis. G, Summary schematic of A-P distribution pattern of Pcs marked at E11.5 (red) and E12.5 (blue). The arrows in E and F indicate positions analyzed in G. H, The percentage of marked Pcs residing in each of the cardinal lobes at E18.5 cerebellum. Error bars indicate SEM. Mb, Midbrain; Cb, cerebellum; anb, anterobasal; and, anterodorsal; cen, central; pos, posterior; inf, inferior. Scale bar: A–C, 200 μm; D–F, 350 μm. *p < 0.05.
Figure 4.
Figure 4.
Temporal fate mapping of cerebellar interneurons reveals inside-to-outside settling in the cortex. All sections were analyzed at P21. A–C, An example of fate-mapped cell types when Tm was administered at E14.5. A, A′, Distinct morphology of basket cells, found in the ml close to Pcl, is shown. Double-labeling immunohistochemistry for parvalbumin (red) and YFP (green) identifies some fate-mapped cells in inner ml as basket cells. B, B′, Distinct morphology of stellate cells located in the outer ml is shown. Double-labeling immunohistochemistry for parvalbumin (red) and YFP (green) in the outer ml identifies some fate-mapped cells as stellate cells. C, C′, Large size of fate-mapped interneurons in the igl indicates Golgi cells. Double-labeling immunohistochemistry for neurogranin (red) and YFP (green) confirms Golgi cell identity. D, A chandelier-shaped candelabrum fate-mapped (YFP+) cell in the inner ml is shown. E–J, Mosaic images of YFP immunohistochemistry in Ascl1CreER GIFM animals when Tm was administered at E13.5 (E), E14.5 (F), E17.5 (G), P0 (H), P1 (I), and P4 (J). K, A comparison of the percentage of each cell type marked at different time points during development is shown (mean ± SEM; n = 3; unpaired t test). The white dotted line indicates pial surface, the red dotted line indicates border between Pcl and igl, and the yellow dotted line indicates border between igl and wm. Pcl, Purkinje cell layer. Scale bar: A–D, 20 μm; E–J, 100 μm.
Figure 5.
Figure 5.
A population of cerebellar interneurons is born during embryonic development. BrdU was administered 12 h before Tm administration at E13.5, E14.5, P2, and P7. A, Double-labeling immunohistochemistry in the outer ml for BrdU (red) and parvalbumin (green) shows some stellate cells are born at E14.5. A′, Double-labeling immunohistochemistry for βgal (red) and BrdU (green) shows an Ascl1CreER GIFM fate-mapped stellate cell born embryonically. B, Double-labeling immunohistochemistry in the inner ml for BrdU (red) and parvalbumin (green) shows some basket cells are born at E14.5. B′, Double-labeling immunohistochemistry for βgal (red) and BrdU (green) shows an Ascl1CreER GIFM fate-mapped basket cell born embryonically. C, Double-labeling immunohistochemistry in the igl for BrdU (green) and neurogranin (red) shows some Golgi cells are born at E14.5. C′, Double-labeling immunohistochemistry for βgal (red) and BrdU (green) shows an Ascl1CreER GIFM fate-mapped Golgi cell born embryonically. D, Quantification of the number of BrdU and βgal double-positive interneurons marked at each time point with Ascl1CreER GIFM is shown (mean ± SEM; n = 3; unpaired t test). Pcl, Purkinje cell layer; pia, pial surface. Scale bar, 20 μm.
Figure 6.
Figure 6.
Temporal fate mapping of cerebellar glia with Ascl1CreER GIFM reveals marking of Bergmann glia only at one time point and other glia during their proliferative phase. Ascl1CreER GIFM marking of Bergmann glia (A–A″), oligodendrocytes (B, B′), and astrocytes (C, C′) is shown. A′, Double-labeling immunohistochemistry for GFAP (red) and YFP (green) confirms the identity of Bergmann glia. A″, BrdU was administered 12 h before Tm administration at E13.5. Double-labeling immunohistochemistry for BrdU (green) and βgal (red) shows Ascl1CreER GIFM and long-term BrdU-marked Bergmann glia. B′, The identity of oligodendrocytes is shown by double-labeling immunohistochemistry for CAII (red) and YFP (green). C′, Double-labeling immunohistochemistry for GFAP (red) and YFP (green) shows some Ascl1CreER GIFM-marked cells are astrocytes. D, The percentage of each type of cerebellar glia marked with Ascl1CreER GIFM at each time point during development is shown (mean ± SEM; n = 4; unpaired t test). Scale bar, 20 μm.
Figure 7.
Figure 7.
Conditional deletion of Ascl1 in the cerebellum differentially affects the number of interneurons and glia in the adult. Hematoxylin and eosin (H&E)-stained sections show smaller cerebellum in a Ptf1a-Ascl1 cko (B) compared with a littermate control (A). The insets in A and B are immunostaining for calbindin showing no difference in the overall morphology of Pcs. H&E-stained sections of En1-Ascl1 ckos (F) show a similar cellular phenotype to Ptf1a-Ascl1 ckos (A). Higher magnification images show severe reductions in the number of ml interneurons in both ckos (D, H) compared with littermate controls (C, G). I, Quantification of the number of Purkinje cells per millimeter in Ptf1a-Ascl1 and En1-Ascl1 ckos and littermate controls. J, Quantification of the average cerebellar circumference in Ptf1a-Ascl1 and En1-Ascl1 ckos and littermate controls with controls set as 1 shows significantly smaller cerebellum size in Ptf1a-Ascl1 ckos (p = 0.01) but not En1-Ascl1 ckos. K, Quantification of the GABAergic interneurons and glia in Ptf1a-Ascl1 and En1-Ascl1 ckos and littermate controls with average control numbers set as 1 (mean ± SEM; Ptf1a-Ascl1 cko, n = 3; Ptf1a-Ascl1 control, n = 3; En1-Ascl1 cko, n = 3; En1-Ascl1 control, n = 3; unpaired t test; the red asterisk depicts p < 0.003; the black asterisk, p < 0.05). Scale bar: A, B, E, F, 100 μm; C, D, G, H, 20 μm.
Figure 8.
Figure 8.
In the absence of Ascl1, granule cell precursors are marked with Ascl1CreER GIFM. A, A′, Xgal staining of cerebellar sections of E17.5 Ascl1CreER/+;R26lacZ/+ mice administered Tm at E11.5 showing marking of only Pcs, in contrast to Ascl1CreER;R26lacZ/+ mice in which gcps in the egl (dotted outline) are marked in addition to Pcs (B, B′). A″, B″, Double-labeling immunohistochemistry of Pax6 (green) and βgal (red) shows that Ascl1CreER GIFM-marked cells within the egl are gcps (Pax6+). Xgal staining of E17.5 cerebellar sections of Ascl1CreER/+;R26lacZ/+ (C, C′) and Ascl1CreER;R26lacZ/+ (D, D′) when Tm was administered at E13.5 reveals marking only of cells within the white matter, some of which are positive for Pax2 (C′, D′). Xgal staining of Ptf1aCre/+;Ascl1CreER;R26lacZ/+ shows more gcps marked within the egl (E, dotted lines) compared with littermate controls (F). Scale bar: A–F, 200 μm; A′, A″, B′, B″, C′, D″, 100 μm.
Figure 9.
Figure 9.
Model for the temporal generation of the cells that form the cerebellar local circuitry. A, Summary of the time points at which vz-derived cells are preferentially marked using Ascl1CreER GIFM. The thickness of the line indicates the relative number of each cell type marked at different time points. B, During early embryogenesis (E10.5–E13.5), Pcs and neurons of the cn are born and begin to make contacts. During mid and late embryogenesis (E13.5–P0), a population of Bg and Golgi interneurons are born. Bg migrate to their final position within the Pc layer to guide newly differentiated gcs toward the igl. Golgi interneurons and gcs within the igl then form synaptic contacts within glomeruli. During early postnatal stages (P0–P5), basket interneurons are primarily generated and contact Pc apical dendrites. Finally, during late postnatal stages (P5–P15), stellate interneurons are mainly generated and occupy the outer region of the ml, and start making contacts with Pc dendrites. Astrocytes and oligodendrocytes are generated after birth and contact their target neurons. Thus, target neurons are generated before the neurons or glia that contact them are generated.

Comment in

References

    1. Altman J, Bayer SA. Development of the cerebellar system in relation to its evolution, structure, and functions. New York: CRC; 1997.
    1. Ango F, Wu C, Van der Want JJ, Wu P, Schachner M, Huang ZJ. Bergmann glia and the recognition molecule CHL1 organize GABAergic axons and direct innervation of Purkinje cell dendrites. PLoS Biol. 2008;6:e103. - PMC - PubMed
    1. Barmack NH, Yakhnitsa V. Functions of interneurons in mouse cerebellum. J Neurosci. 2008;28:1140–1152. - PMC - PubMed
    1. Bastianelli E. Distribution of calcium-binding proteins in the cerebellum. Cerebellum. 2003;2:242–262. - PubMed
    1. Battiste J, Helms AW, Kim EJ, Savage TK, Lagace DC, Mandyam CD, Eisch AJ, Miyoshi G, Johnson JE. Ascl1 defines sequentially generated lineage-restricted neuronal and oligodendrocyte precursor cells in the spinal cord. Development. 2007;134:285–293. - PubMed

Publication types

MeSH terms

LinkOut - more resources