. 2011 Sep 23;286(38):33632-40.
doi: 10.1074/jbc.M111.265637. Epub 2011 Jul 27.

Cellular content of UDP-N-acetylhexosamines controls hyaluronan synthase 2 expression and correlates with O-linked N-acetylglucosamine modification of transcription factors YY1 and SP1

Affiliations

Cellular content of UDP-N-acetylhexosamines controls hyaluronan synthase 2 expression and correlates with O-linked N-acetylglucosamine modification of transcription factors YY1 and SP1

Tiina A Jokela et al. J Biol Chem. .

Abstract

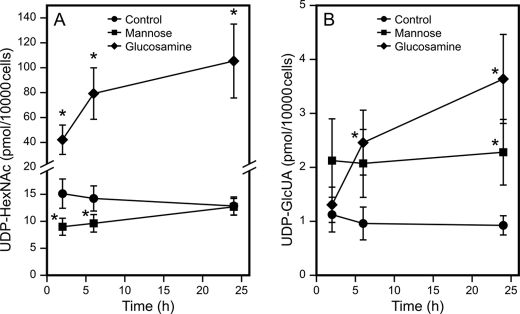
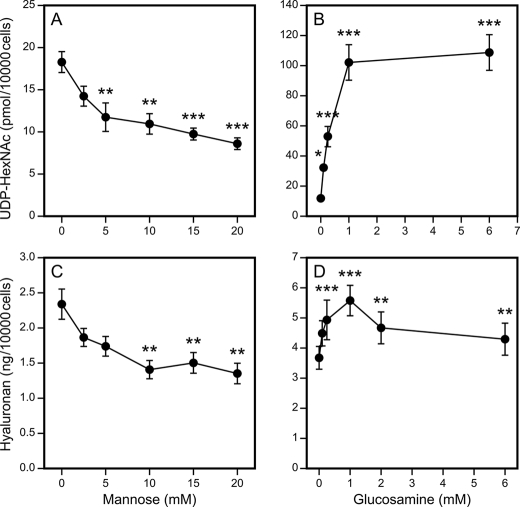
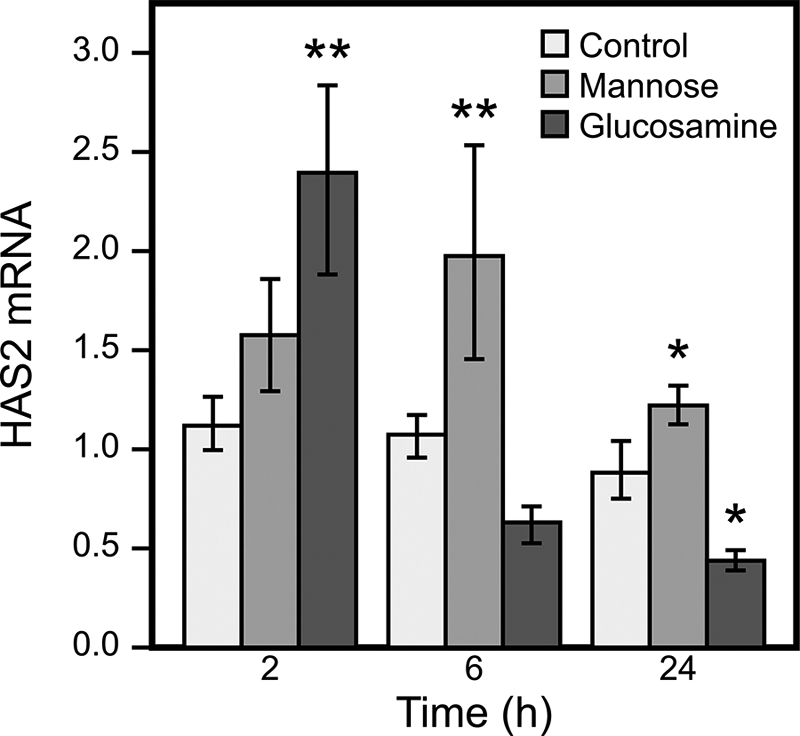
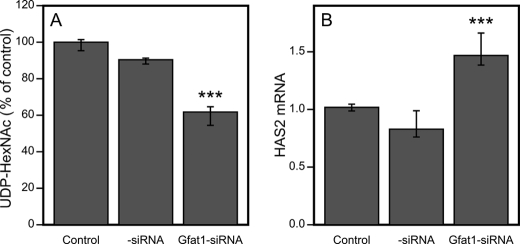
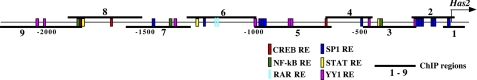
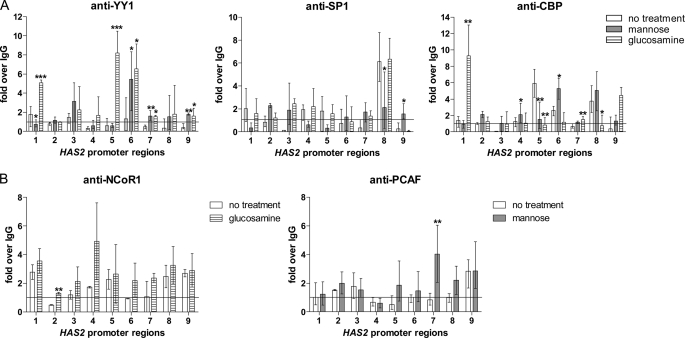
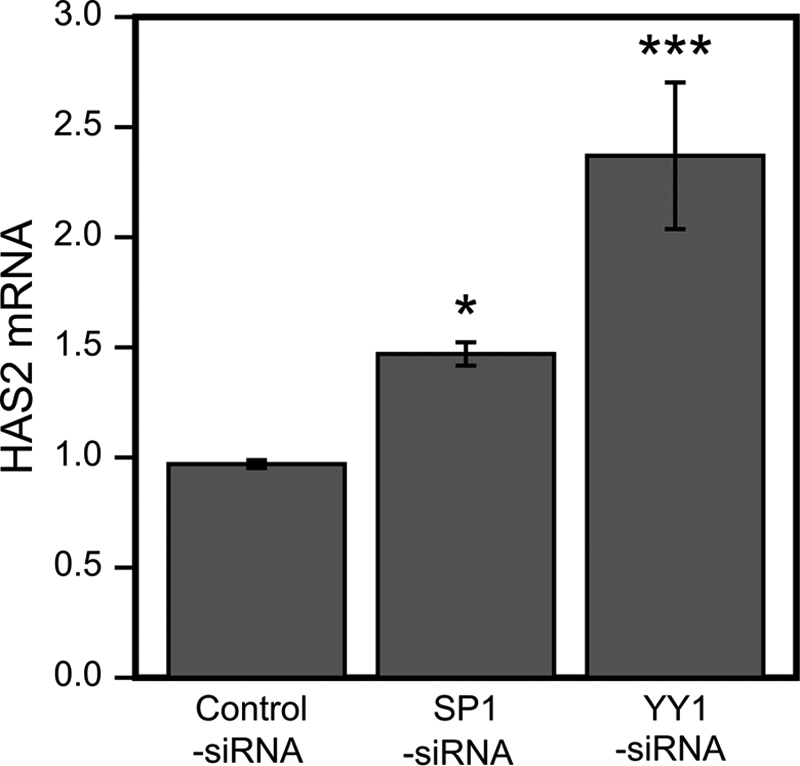
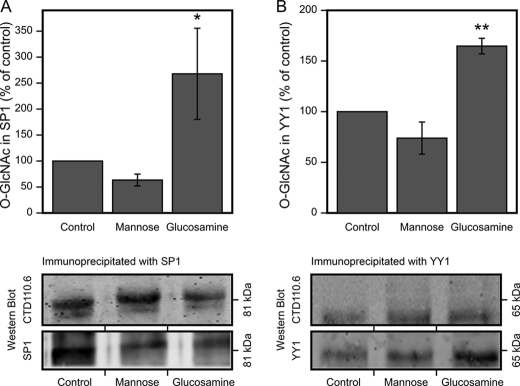
Hyaluronan, a high molecular mass polysaccharide on the vertebrate cell surface and extracellular matrix, is produced at the plasma membrane by hyaluronan synthases using UDP-GlcNAc and UDP-GlcUA as substrates. The availability of these UDP-sugar substrates can limit the synthesis rate of hyaluronan. In this study, we show that the cellular level of UDP-HexNAc also controls hyaluronan synthesis by modulating the expression of HAS2 (hyaluronan synthase 2). Increasing UDP-HexNAc in HaCaT keratinocytes by adding glucosamine down-regulated HAS2 gene expression, whereas a decrease in UDP-HexNAc, realized by mannose treatment or siRNA for GFAT1 (glutamine:fructose-6-phosphate amidotransferase 1), enhanced expression of the gene. Tracing the UDP-HexNAc-initiated signal to the HAS2 promoter revealed no change in the binding of STAT3, NF-κB, and cAMP response element-binding protein, shown previously to mediate growth factor and cytokine signals on HAS2 expression. Instead, altered binding of SP1 and YY1 to the promoter correlated with cellular UDP-HexNAc content and inhibition of HAS2 expression. siRNA silencing of YY1 and SP1 confirmed their inhibitory effects on HAS2 expression. Reduced and increased levels of O-GlcNAc-modified SP1 and YY1 proteins were associated with stimulation or inhibition of HAS2 expression, respectively. Our data are consistent with the hypothesis that, by regulating the level of protein O-GlcNAc modifications, cellular UDP-HexNAc content controls HAS2 transcription and decreases the effects on hyaluronan synthesis that would result from cellular fluctuations of this substrate.


Figures

FIGURE 1.
FIGURE 1.
Effect of mannose and glucosamine on the dynamics of UDP-HexNAc and UDP-GlcUA content in keratinocytes. 24 h after changing to fresh medium, concentrated mannose and glucosamine were added to HaCaT cell cultures, resulting in 20 and 6 mm final concentrations, respectively. UDP-HexNAc (A) and UDP-GlcUA (B) content was analyzed in the treated and control (with no addition) cultures after 2, 6, and 24 h. The data represent means ± S.E. of five independent experiments. *, p < 0.05 (by F-test univariate analysis of variance).
FIGURE 2.
FIGURE 2.
Concentration dependence of mannose and glucosamine modulation of UDP-HexNAc contents and hyaluronan synthesis. HaCaT cells were incubated with 0–20 mm mannose (A and C) and 0–6 mm glucosamine (B and D) for 6 h and analyzed for UDP-HexNAc content (A and B). Hyaluronan secreted in the culture medium during a 24-h period is shown in C and D. The data represent means ± S.E. of three (A and B) and five (C and D) independent experiments (each experiment with one or more replicates). Statistical significance between control and mannose- or glucosamine-treated cultures is as follows: *, p < 0.05; **, p < 0.01; ***, p < 0.001 (by Dunnett's test).
FIGURE 3.
FIGURE 3.
Time-dependent effects of mannose and glucosamine on HAS2 gene expression. HaCaT cell cultures were incubated with 20 mm mannose and 6 mm glucosamine for 2, 6, and 24 h, and HAS2 mRNA was analyzed by quantitative RT-PCR. The data represent means ± S.E. of three experiments (each with one or more replicates). Statistical significance between control and mannose- or glucosamine-treated cultures is as follows: *, p < 0.05; **, p < 0.01 (by Dunnett's test).
FIGURE 4.
FIGURE 4.
Effect of GFAT1 siRNA on UDP-HexNAc content and HAS2 mRNA levels. A, UDP-HexNAc contents were analyzed 48 h after HaCaT cell cultures were transfected with GFAT1 siRNA. B, HAS2 mRNA levels were normalized to the control gene RPLP0 as described under “Experimental Procedures.” The data represent means ± range of two separate experiments (each with four replicate samples; A) and three separate experiments (each with five replicate samples; B). ***, p < 0.001 (control siRNA versus GFAT1 siRNA; by Dunnett's test).
FIGURE 5.
FIGURE 5.
Overview of the human HAS2 promoter and recruitment of transcription regulators. The first 2250 bp of the human HAS2 promoter were screened in silico for putative transcription factor-binding sites. The locations of the genomic regions used in ChIP assays are indicated by horizontal bars. RAR, retinoid acid receptor; STAT, signal transducer and activator of transcription.
FIGURE 6.
FIGURE 6.
Recruitment of YY1, SP1, and their cofactors to the HAS2 promoter in response to mannose and glucosamine. Chromatin was extracted from HaCaT cells that had been treated with mannose (6 h, 20 mm) or glucosamine (6 h, 6 mm) or left untreated. ChIP experiments were performed using antibodies against the transcription factors YY1 and SP1 (A) and the cofactors CBP (A), NCoR1 (B), and PCAF (B). PCR was performed with primers specific for the nine regions of the human HAS2 promoter shown in Fig. 5. PCR conducted on DNA derived from input chromatin template served as a positive control, and that of IgG-precipitated template served as a specificity control. The results represent -fold over the IgG-precipitated samples, meaning that values >1 indicate specific binding. The error bars represent the mean ± range of at least three independent experiments. Statistical significance between control and mannose- or glucosamine-treated cultures is as follows: *, p < 0.05; **, p < 0.01; ***, p < 0.001 (by Dunnett's test).
FIGURE 7.
FIGURE 7.
SP1 and YY1 silencing increases HAS2 mRNA. HaCaT cell cultures transfected with control, SP1, and YY1 siRNAs were analyzed for HAS2 mRNA normalized to the control gene RPLP0 as described under “Experimental Procedures.” The values are related to non-transfected cultures and represent means ± S.E. of four independent experiments (each with two replicates). Statistical significances between cultures treated with control siRNA versus SP1 and YY1 siRNA are as follows: *, p < 0.05; ***, p < 0.001 (by Dunnett's test).
FIGURE 8.
FIGURE 8.
Effect of mannose and glucosamine on O-GlcNAc modification of SP1 and YY1. HaCaT cell cultures were incubated with 20 mm mannose and 6 mm glucosamine for 6 h, total protein was extracted, and SP1 and YY1 were immunoprecipitated. Western blots of the immunoprecipitates were analyzed with anti-O-GlcNAc and anti-SP1 or anti-YY1 antibodies, and the intensities of O-GlcNAc-modified protein and total SP1 and YY1 were measured. The data represent means ± S.E. of the ratio of band intensities between O-GlcNAc and total SP1 (A) and YY1 (B) signals in four independent experiments (each with one or more replicates). Examples of the blots are shown below the corresponding panels of SP1 and YY1. A significant difference existed between control, mannose, and glucosamine groups in SP1 (p = 0.021) and YY1 (p = 0.000) by univariate analysis of variance. *, p < 0.05; **, p < 0.01 (Dunnett's test).

References

    1. Toole B. P. (2004) Nat. Rev. Cancer 4, 528–539 - PubMed
    1. Weigel P. H., DeAngelis P. L. (2007) J. Biol. Chem. 282, 36777–36781 - PubMed
    1. Kuroda K., Utani A., Hamasaki Y., Shinkai H. (2001) J. Dermatol. Sci. 26, 156–160 - PubMed
    1. Jacobson A., Brinck J., Briskin M. J., Spicer A. P., Heldin P. (2000) Biochem. J. 348, 29–35 - PMC - PubMed
    1. Yamada Y., Itano N., Hata K., Ueda M., Kimata K. (2004) J. Invest. Dermatol. 122, 631–639 - PubMed

Publication types

MeSH terms

LinkOut - more resources