Comparative Study
. 2011 Nov;36(12):2513-28.
doi: 10.1038/npp.2011.140. Epub 2011 Jul 27.

Synaptic and morphological neuroadaptations in the putamen associated with long-term, relapsing alcohol drinking in primates

Affiliations
Comparative Study

Synaptic and morphological neuroadaptations in the putamen associated with long-term, relapsing alcohol drinking in primates

Verginia C Cuzon Carlson et al. Neuropsychopharmacology. 2011 Nov.

Abstract

Alcoholism and alcohol use disorders are characterized by several months to decades of heavy and problematic drinking, interspersed with periods of abstinence and relapse to heavy drinking. This alcohol-drinking phenotype was modeled using macaque monkeys to explore neuronal adaptations in the striatum, a brain region controlling habitual behaviors. Prolonged drinking with repeated abstinence narrowed the variability in daily intake, increased the amount of ethanol consumed in bouts, and led to higher blood ethanol concentrations more than twice the legal intoxication limit. After the final abstinence period of this extensive drinking protocol, we found a selective increase in dendritic spine density and enhanced glutamatergic transmission in the putamen, but not in the caudate nucleus. Intrinsic excitability of medium-sized spiny neurons was also enhanced in the putamen of alcohol-drinking monkeys in comparison with non-drinkers, and GABAeric transmission was selectively suppressed in the putamen of heavy drinkers. These morphological and physiological changes indicate a shift in the balance of inhibitory/excitatory transmission that biases the circuit toward an enduring increase in synaptic activation of putamen output as a consequence of prolonged heavy drinking/relapse. The resultant potential for increased putamen activation may underlie an alcohol-drinking phenotype of regulated drinking and sustained intoxication.


Figures

Figure 1
Figure 1
Experimental time line and examples of brain sections used for morphology and electrophysiology. (a) A model depicting the experimental time line. (b) Example of a 4-mm-thick brain section obtained from the sectioning of the monkey brain in a brain matrix. The caudate is outlined in blue. The putamen is outlined in red. The caudate and putamen are separated by the internal capsule. The section is further blocked for morphological and electrophysiological analyses and is denoted by a dashed box. The red box in the putamen denotes the area in which MSNs were targeted for electrophysiological recording.
Figure 2
Figure 2
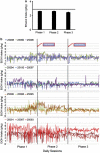
Repeated abstinence effects on ethanol daily intake. (a) Effects of repeated abstinence on mean (±SEM) daily ethanol (EtOH) intake (g/kg). The horizontal line indicates baseline EtOH intake measures averaged over 8 months preceding phase 1 (see Figure 1a for phases). (b) The variability in daily EtOH intake over the three phases in individual monkeys arranged from lowest (top) to highest (bottom) average daily drinkers. Variability in intakes decreased significantly from phase 1 to phase 3. Only four monkeys had short-term increases in intakes after the first abstinence (25 090, 25 096, 25 097, 25 095), with three showing a short-term decline (25 098, 25 099, 25 086) and the rest showing no change in daily intakes. The second abstinence had little or no effect on average daily intakes.
Figure 3
Figure 3
Blood ethanol concentrations in the three pre-abstinent drinking phases. (a) The effect of repeated abstinence on mean (±SEM) BECs. The solid horizontal line indicates baseline BECs averaged over 8 months preceding phase 1. (b) The individual and average BEC (solid bars±SEM) measurements for individual monkeys during phase 1 (blue), phase 2 (green), and phase 3 (red) arranged from the lowest (top left) to the highest (bottom right) average daily drinkers.
Figure 4
Figure 4
Repeated abstinence effects on drinking characteristics. (a and b) Effects of repeated abstinence on mean (± SEM) bout volumes (panel a) and bout durations (panel b). The horizontal lines indicate baseline measures of bout volume (panel a) or bout duration (panel b) averaged over 8 months preceding phase 1. (c) Cumulative records of drinking in phases 1 and 3 of monkey 25 087 chosen for matched total intake at the time of BECs (dashed line). (d) Key variables summarizing the drinking patterns in panel c for monkey 25 087 during phases 1 and 3. (e and f) Average water bout volumes (panel e) and water bout duration (panel f) were significantly greater during phase 1 than during phases 2 and 3. The horizontal lines indicate baseline measures of water bout volume (panel e) and water bout duration (panel f) averaged over 8 months preceding phase 1.
Figure 5
Figure 5
Effects of repeated abstinence on withdrawal signs and normal behaviors. (a) Withdrawal signs observed 3–5 days before abstinence (intoxication), the first 24–72 h of withdrawal (acute withdrawal), and 17–25 days into withdrawal (protracted withdrawal) during abstinence periods 1 (a1), 2 (a2), and 3 (a3). Withdrawal signs were most noticeable during acute withdrawal and diminished in protracted withdrawal, with significantly greater intentional tremors during acute withdrawal (χ2(2,N=3)=6.2, p=0.046) and huddling (χ2(2,N=3)=6.8, p=0.03). Fewer monkeys showed withdrawal signs in the second and third abstinence compared with the first, except for body shake and huddle, although there were no significant differences between the abstinence periods. (b) Conversely, the normal activity taken at the same time as the withdrawal signs increased in the protracted phase of withdrawal compared with intoxication or acute withdrawal, a trend that was statistically significant during abstinence 1 (χ2(2,N=11)=20.2, p<0.0001). There was an increase in normal behaviors in abstinence 3 compared with the first abstinence (χ2(2,N=33)=21.7, p<0.0001).
Figure 6
Figure 6
Morning (0800 hours, light on 0600 hours) cortisol measures from male cynomolgus monkeys that underwent repeated withdrawal protocol. These samples were taken before dexamethasone (DEX) treatment. Samples were obtained before induction (base); after 30 sessions of 1.5 g/kg per day induced dose of EtOH (Ind); after 6 and 12 months, respectively, of 22 h/day self-administration (range of mean daily intakes per monkey was 2.0–5.6 g/kg per day or approximately 8–22 drinks per day). 'A1' and ‘A1.1' were taken at 48 h and the 18th day of the first abstinence, respectively. Abstinence was imposed for 28 days. Between A1 and A2, there were 4 months of 22 h access to EtOH (cortisol not sampled). After the second abstinence period (again 28 days), cortisol was sampled in the 4th month of 22 h access to EtOH (20 months). A3 and 3.1 were taken at 48 h and the 18th day of the third abstinence period, respectively. There was a main effect of experimental phase (F(9, 81)=6.7, p<0.001) and pairwise decrease in cortisol at 20 months compared with baseline (t=2.7, p<0.02), and pairwise increase in all samples during all abstinence times compared to baseline (all p<0.01).
Figure 7
Figure 7
EtOH exposure increases spine density in the monkey putamen but not in the caudate. (a) Example of a putamen MSN labeled using DiOlistics. (b) Confocal image of MSN dendrite in the putamen of control (b1) and EtOH-drinking (b2) monkeys showing dendritic spines. (c) Cumulative distribution of spine densities of MSNs from the caudate (c1) and the putamen (c2) of control and EtOH monkeys (n for control=4 monkeys; n for EtOH-drinking=6 monkeys; 15–25 neurons, 44–80 dendrites). (d) Spine density (mean±SEM) of MSNs in putamen control and EtOH-drinking monkeys vs mean BECs during phase 3. (e and f) No significant difference in spine width (panel e) and length (panel f) between MSNs analyzed in the putamen and caudate of control (black) and EtOH (gray) monkeys. (Panel e) Putamen spine length: 1.33±0.04 μm for control and 1.34±0.05 μm for EtOH. Caudate spine length: 1.37±0.04 μm for control and 1.43±0.07 μm for EtOH. (Panel f) Putamen spine width: 0.88±0.02 μm for control and 0.87±0.01 μm for EtOH. Caudate spine width: 0.88±0.01 μm for control and 0.87±0.01 μm for EtOH. N=4–6 monkeys, 43–76 dendrites; 30–50 spines/dendrite.
Figure 8
Figure 8
Chronic EtOH exposure with imposed abstinence increases the frequency of mEPSCs. (a and b) Representative mEPSCs recorded from MSNs from control (panel a) and EtOH (panel b) monkeys. (c–h) The average (panel c), cumulative distribution (panel d), and correlation with BEC (panel e) interevent interval (IEI) of mEPSCs measured in putamen MSNs. (Panels e–h) The average amplitude (f), area (g), rise time, and decay time (h) of mEPSCs measured in MSNs.
Figure 9
Figure 9
Chronic EtOH exposure with imposed abstinence decreases the frequency and amplitude of mIPSCs in MSNs of the monkey putamen. (a and b) Representative mIPSCs recorded from MSNs in slices obtained from control (panel a) and EtOH (panel b) monkeys. (c–e) The average (panel c), cumulative distribution (panel d), and relationship with blood EtOH concentration (panel e) of mIPSC interevent interval (IEI) measured in control (black) and EtOH (gray) monkeys. (f–h) The average amplitude (f), area (g), and rise and decay times (h) of mIPSCs measured in MSNs of control and EtOH monkeys. *Statistically significant differences from control at P<0.05.
Figure 10
Figure 10
Correlation between cortisol levels measured during chronic drinking and early and late in abstinence 3, and MSN spine density, mEPSC IEI, and mIPSC IEI. (a–c) The average spine density (panel a), mEPSC IEI (panel b), and mIPSC IEI (panel c) for each monkey was plotted vs the value of cortisol measured for that individual during chronic drinking (a1, b1, c1), early in abstinence 3 (a2, b2, c2), and late in abstinence 3 (a3, b3, c3).
Figure 11
Figure 11
Intrinsic membrane properties of MSNs recorded from control and EtOH monkeys are slightly different. (a and b) Responses to hyperpolarizing and depolarizing current injections in cells recorded from MSNs from slices obtained from control (panel a) and EtOH (panel b) monkeys. (c and d) Capacitance (panel c) was unchanged, whereas input resistance was slightly lower in EtOH than in controls (panel d). (e)The resting membrane potential and the action potential threshold were more depolarized in EtOH compared with controls. (f) The relationship between depolarizing current injection and the frequency of action potentials elicited. *Statistically significant differences from control at P<0.05.

Similar articles

Cited by

References

    1. Acosta G, Hasenkamp W, Daunais JB, Friedman DP, Grant KA, Hemby SE. Ethanol self-administration modulation of NMDA receptor subunit and related synaptic protein mRNA expression in prefrontal cortical fields in cynomolgus monkeys. Brain Res. 2010;1318:144–154. - PMC - PubMed
    1. Balleine BW, Delgado MR, Hikosaka O. The role of the dorsal striatum in reward and decision-making. J Neurosci. 2007;127:8161–8165. - PMC - PubMed
    1. Becker HC, Lopez MF. Increased ethanol drinking after repeated chronic ethanol exposure and withdrawal experience in C57BL/6J mice. Alcohol Clin Exp Res. 2004;28:1829–1838. - PubMed
    1. Carden WB, Alexander GM, Friedman DP, Daunais JB, Grant KA, Mu J, et al. Chronic ethanol drinking reduces native T-type calcium current in the thalamus of nonhuman primates. Brain Res. 2006;1089:92–100. - PubMed
    1. Cheng HJ, Grant KA, Han QH, Daunais JB, Friedman DP, Masutani S, et al. Up-regulation and functional effect of cardiac beta(3)-adrenoreceptors in alcoholic monkeys. Alcohol Clin Exp Res. 2010;34:1171–1181. - PMC - PubMed

Publication types