. 2011 Apr 4;1(1):15.
doi: 10.1186/2044-5040-1-15.

Deregulation of the ubiquitin-proteasome system is the predominant molecular pathology in OPMD animal models and patients

Affiliations

Deregulation of the ubiquitin-proteasome system is the predominant molecular pathology in OPMD animal models and patients

Seyed Yahya Anvar et al. Skelet Muscle. .

Abstract

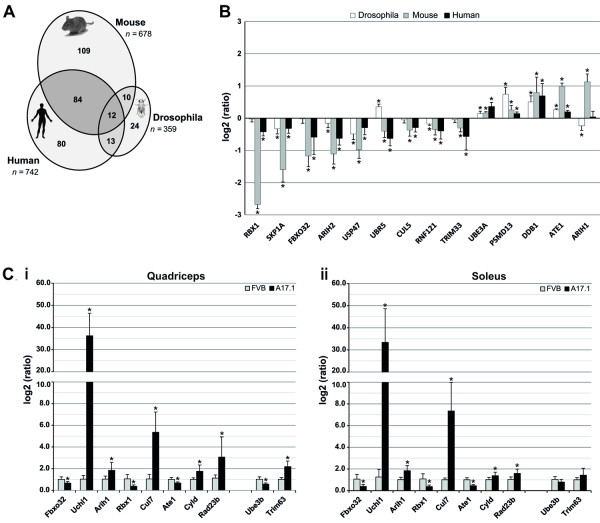
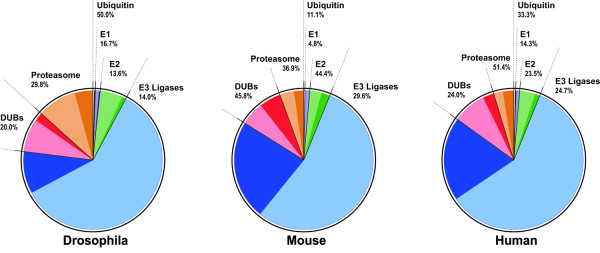
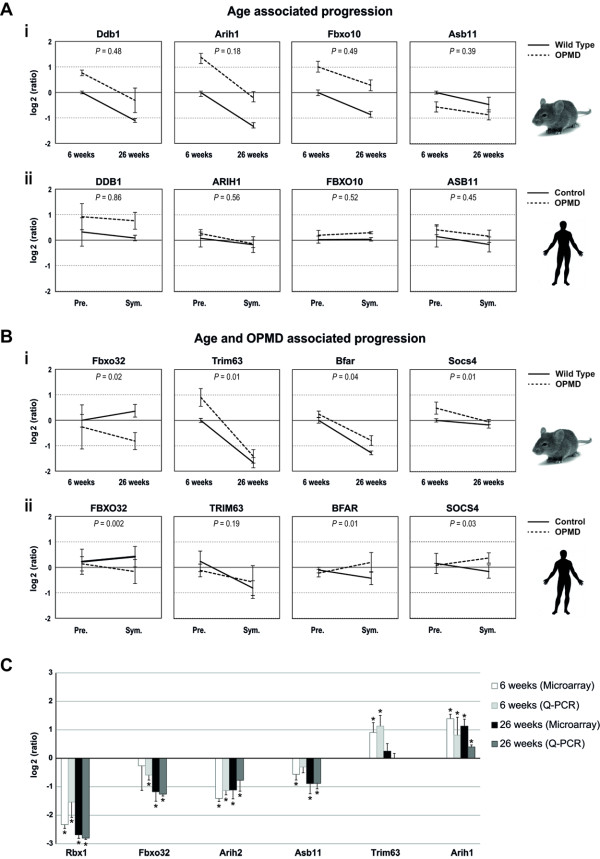
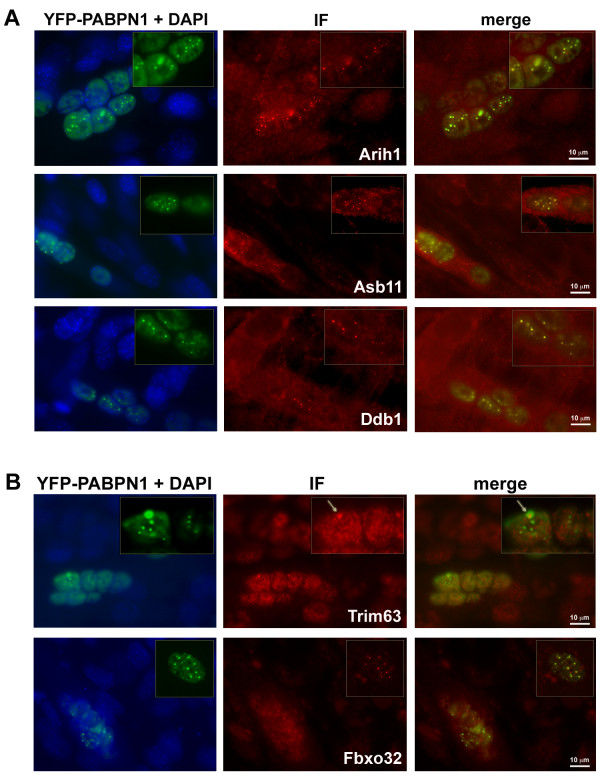
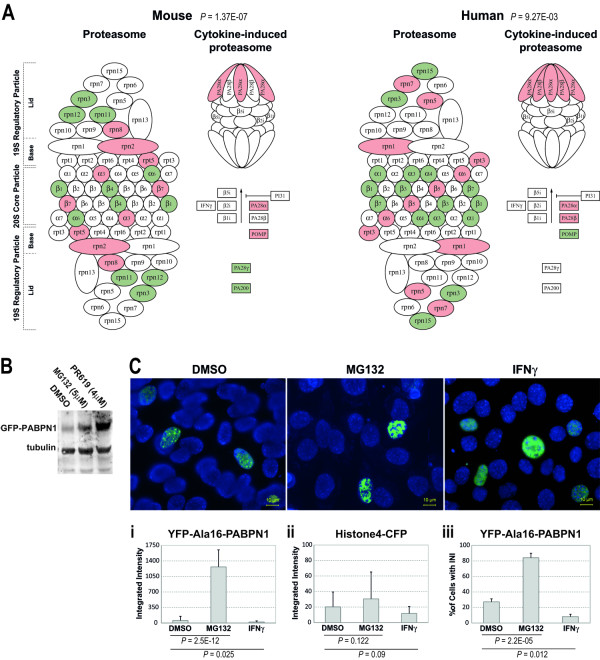
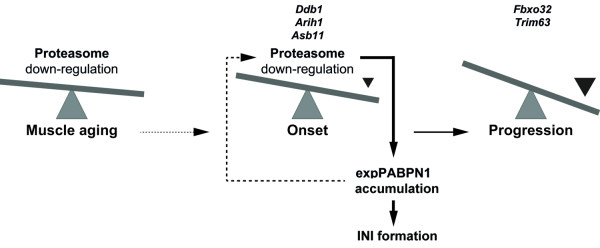
Oculopharyngeal muscular dystrophy (OPMD) is a late-onset progressive muscle disorder caused by a poly-alanine expansion mutation in the Poly(A) Binding Protein Nuclear 1 (PABPN1). The molecular mechanisms that regulate disease onset and progression are largely unknown. In order to identify molecular pathways that are consistently associated with OPMD, we performed an integrated high-throughput transcriptome study in affected muscles of OPMD animal models and patients. The ubiquitin-proteasome system (UPS) was found to be the most consistently and significantly OPMD-deregulated pathway across species. We could correlate the association of the UPS OPMD-deregulated genes with stages of disease progression. The expression trend of a subset of these genes is age-associated and therefore, marks the late onset of the disease, and a second group with expression trends relating to disease-progression. We demonstrate a correlation between expression trends and entrapment into PABPN1 insoluble aggregates of OPMD-deregulated E3 ligases. We also show that manipulations of proteasome and immunoproteasome activity specifically affect the accumulation and aggregation of mutant PABPN1. We suggest that the natural decrease in proteasome expression and its activity during muscle aging contributes to the onset of the disease.


Figures

Figure 1
Figure 1
Cross species deregulation of ubiquitin-proteasome in OPMD. A) Venn-diagram displaying the overlap in OPMD-deregulated genes in UPS across species. In mice and Drosophila, OPMD-deregulated genes should be consistently deregulated in at least two time points. The total number of genes in UPS is indicated in italics. The list of OPMD-deregulated UPS genes is in Additional File 2. B) Transcriptional changes of selected genes in UPS in different organisms. Histograms display the log2(ratio) of the measured expression values in Drosophila (white bars), mice (gray bars), and humans (black bars). Significant changes with the adjusted P < 0.05 are indicated by *. C) RT Q-PCR validation of selected deregulated genes in UPS was carried out on quadriceps (i) and soleus (ii) muscles of six-week-old mice. Histograms show the measured expression values for A17.1 and FVB mice using Q-PCR. Significant changes of measured expression values of A17.1 mice as compared to FVB with the P < 0.05 are indicated by *.
Figure 2
Figure 2
OPMD deregulated genes in the UPS. Pie charts show the relative distribution of the UPS units (light colors) and OPMD-deregulated genes (dark colors) per organism. Numbers indicate the percentage of OPMD-deregulation.
Figure 3
Figure 3
Progressive changes in UPS gene expression. Progression trends for selected genes in mice (i) and humans (ii). Expression values were normalized to six-week-old WT in mice, and to young healthy controls (19 years old on average) in humans. P-values demonstrate the significance of differences in expression trends between controls and OPMD samples. A) The age-associated progression trend is indicated by P-value >0.05. B) The genotype-specific progression trend is indicated by P-values <0.05. SD represents variations in mice (6 weeks N = 5 and 26 weeks N = 6) and in humans (expPABPN1 carriers N = 4 and controls N = 5). C) RT Q-PCR validation of selected deregulated genes in UPS was carried out on skeletal muscles of 6-week-old and 26-week-old mice. Histograms show the log2(ratio) of the measured expression values using microarray and Q-PCR. Significant changes with the P <0.05 are indicated by *.
Figure 4
Figure 4
Co-localization of selected E3 ligases with INI in C2C12 myotubes expressing YFP-Ala16PABPN1. Immunostaining of E3-ligases was visualized with Alexa-594 secondary antibodies. Co-localization with expPABPN1 in myotubes is demonstrated in the merge image. A 2.5X magnification of nuclei containing expPABPN1 aggregates is highlighted in a box. A) Arih1, Asb11 and Ddb1 E3 ligases show consistent co-localization with aggregated YFP-Ala16-PABPN1. B) Trim63 and Fbxo32 E3 ligases show progressively more co-localization with YFP-Ala16-PABPN1 as INI size increases. Scale bar is 10 μm.
Figure 5
Figure 5
The effect of altered proteasome activity on expPABPN1 accumulation and aggregation. A) Substantial deregulation of proteasome and immunoproteasome encoding genes in mice and humans. Down-regulation (green) is more pronounced in the core subunit of the proteasome. Immunoproteasome shows consistent up-regulation (red) in both organisms. B) Western blot analysis of YFP-Ala16-PABPN1 transfected C2C12 cells that were treated with 5 μM MG132 or 5 nM PR619. Control cells were treated with DMSO. C) Images show YFP-Ala16-PABPN1 localization in C2C12 after mock-treatment (DMSO), 5 μM MG132 or 5 U/ml IFNγ. Scale bar equals 10 μm. Histograms show the integrated intensity of YFP-Ala16-PABPN1 (i) or Histone4-CFP (control) (ii), and the percentage of cells with INI in YFP-Ala16-PABPN1 expressing cells (iii). Averages represent 509, 773 and 476 cells for DMSO, MG132 and IFNγ, respectively. Significant difference between treatments is reflected by P-values.
Figure 6
Figure 6
A model for the involvement of UPS in OPMD disease pathology. In muscle, age-associated proteasome down-regulation affects expPABPN1 protein accumulation. Elevated expPABPN1 accumulation affects proteasome deregulation during disease onset. Expression profiles of E3-ligases can be sued to separate disease onset from progression.

References

    1. Fan X, Rouleau GA. Progress in understanding the pathogenesis of oculopharyngeal muscular dystrophy. Can J Neurol Sci. 2003;30:8–14. - PubMed
    1. Blumen SC, Bouchard JP, Brais B, Carasso RL, Paleacu D, Drory VE, Chantal S, Blumen N, Braverman I. Cognitive impairment and reduced life span of oculopharyngeal muscular dystrophy homozygotes. Neurology. 2009;73:596–601. doi: 10.1212/WNL.0b013e3181b388a3. - DOI - PubMed
    1. Brais B, Xie YG, Sanson M, Morgan K, Weissenbach J, Korczyn AD, Blumen SC, Fardeau M, Tomé FM, Bouchard JP. et al. The oculopharyngeal muscular dystrophy locus maps to the region of the cardiac alpha and beta myosin heavy chain genes on chromosome 14q11.2-q13. Hum Mol Genet. 1995;4:429–434. doi: 10.1093/hmg/4.3.429. - DOI - PubMed
    1. Brais B, Bouchard JP, Xie YG, Rochefort DL, Chretien N, Tome FM, Lafrenière RG, Rommens JM, Uyama E, Nohira O, Blumen S, Korczyn AD, Heutink P, Mathieu J, Duranceau A, Codère F, Fardeau M, Rouleau GA. Short GCG expansions in the PABP2 gene cause oculopharyngeal muscular dystrophy. Nat Genet. 1998;18:164–167. doi: 10.1038/ng0298-164. - DOI - PubMed
    1. Tome FM, Fardeau M. Nuclear inclusions in oculopharyngeal dystrophy. Acta Neuropathol. 1980;49:85–87. doi: 10.1007/BF00692226. - DOI - PubMed