Review
. 2011 Oct 21:287:160-70.
doi: 10.1016/j.jtbi.2011.06.037. Epub 2011 Jul 23.

Systems biology approaches for understanding cellular mechanisms of immunity in lymph nodes during infection

Affiliations
Review

Systems biology approaches for understanding cellular mechanisms of immunity in lymph nodes during infection

Henry P Mirsky et al. J Theor Biol. .

Abstract

Adaptive immunity is initiated in secondary lymphoid tissues when naive T cells recognize foreign antigen presented as MHC-bound peptide on the surface of dendritic cells. Only a small fraction of T cells in the naive repertoire will express T cell receptors specific for a given epitope, but antigen recognition triggers T cell activation and proliferation, thus greatly expanding antigen-specific clones. Expanded T cells can serve a helper function for B cell responses or traffic to sites of infection to secrete cytokines or kill infected cells. Over the past decade, two-photon microscopy of lymphoid tissues has shed important light on T cell development, antigen recognition, cell trafficking and effector functions. These data have enabled the development of sophisticated quantitative and computational models that, in turn, have been used to test hypotheses in silico that would otherwise be impossible or difficult to explore experimentally. Here, we review these models and their principal findings and highlight remaining questions where modeling approaches are poised to advance our understanding of complex immunological systems.


Figures

Figure 1
Figure 1
Lymph node structure. (a) Schematic of a lymph node showing afferent lymphatics (AL), high endothelial venules (HEV), medullary sinuses (MS), efferent lymphatics (EL), T cell zone (TCZ), and B cell follicles (BCF). Our focus is a TCZ where activation of T cells occurs. The LN is also the site of B cell activation. B cells are generally confined to the BCF and are not discussed here. (b) Fluorescent image of a Cynomologus macaque lymph node cross-section showing T cells (CD3+, blue), B cells (CD20+, red), and macrophages and dendritic cells (CD11+, green). Lymph node is approximately 3 mm × 2 mm. Image courtesy of JoAnne Flynn and Josh Mattila (Univ. of Pittsburgh).
Figure 1
Figure 1
Lymph node structure. (a) Schematic of a lymph node showing afferent lymphatics (AL), high endothelial venules (HEV), medullary sinuses (MS), efferent lymphatics (EL), T cell zone (TCZ), and B cell follicles (BCF). Our focus is a TCZ where activation of T cells occurs. The LN is also the site of B cell activation. B cells are generally confined to the BCF and are not discussed here. (b) Fluorescent image of a Cynomologus macaque lymph node cross-section showing T cells (CD3+, blue), B cells (CD20+, red), and macrophages and dendritic cells (CD11+, green). Lymph node is approximately 3 mm × 2 mm. Image courtesy of JoAnne Flynn and Josh Mattila (Univ. of Pittsburgh).
Figure 2
Figure 2
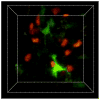
Single-cell imaging of T cell and DCs dynamics with two-photon microscopy. The image is an individual frame from a 3D time-lapse video recording of dye-labeled T cells (red) and DCs (green) in the mouse lymph node. The image volume is approximately 100×80×50μm.
Figure 3
Figure 3
Principal dynamics leading to T cell priming by Ag-DCs in the T cell zone of a LN during an immune response. T cells enter through HEVs while DCs enter through ALs. Motile T cells exhibit short-term persistence but maintain a longer- term random walk as they scan DCs for cognate antigen, exhibiting characteristic free path lengths, speed distributions, and motility coefficients. This is supported by a LN environment that contains a dense FRC network and chemical signals. Once cognate antigen is located, T cells proceed through a multi-phase activation process, with Phase 1, transient interactions, and Phase 2, more prolonged interactions that include T cell clusters and swarms, defined based on 2PM data (Miller et al. 2004b; Mempel et al. 2004), (see above section 2.2 for greater details on phases). Ultimately, successful interactions lead to T cell activation, proliferation and egress to site of infection.

References

    1. Anderson AO, Shaw S. T cell adhesion to endothelium: the FRC conduit system and other anatomic and molecular features which facilitate the adhesion cascade in lymph node. Semin Immunol. 1993;5(4):271–82. - PubMed
    1. Agrawal NG, Linderman JJ. Calcium response of helper T lymphocytes to antigen-presenting cells in a single-cell assay. Biophys J. 1995;69:1178–1190. - PMC - PubMed
    1. Aoshi T, Zinselmeyer BH, Konjufca V, Lynch JN, Zhang X, Koide Y, Miller MJ. Bacterial entry to the splenic white pulp initiates antigen presentation to CD8+ T cells. Immunity. 2008;29:476–486. - PubMed
    1. Arstila TP, Casrouge A, Baron V, Even J, Kanellopoulos J, Kourilsky P. A direct estimate of the human alphabeta T cell receptor diversity. Science. 1999;286 (5441):958–961. - PubMed
    1. Bajaria SH, Webb G, Cloyd M, Kirschner D. Dynamics of naive and memory CD4+ T lymphocytes in HIV-1 disease progression. J Acquir Immune Defic Syndr. 2002;30:41–58. - PubMed

Publication types