

NG2 expression in glioblastoma identifies an actively proliferating population with an aggressive molecular signature
- PMID: 21798846
- PMCID: PMC3145476
- DOI: 10.1093/neuonc/nor088
NG2 expression in glioblastoma identifies an actively proliferating population with an aggressive molecular signature
Abstract
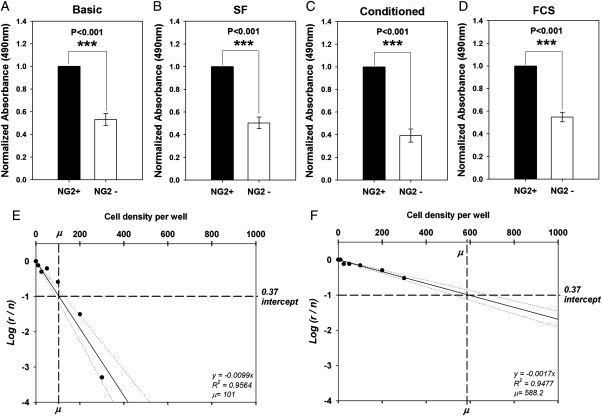
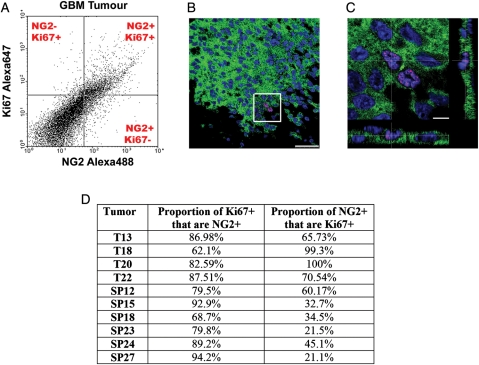
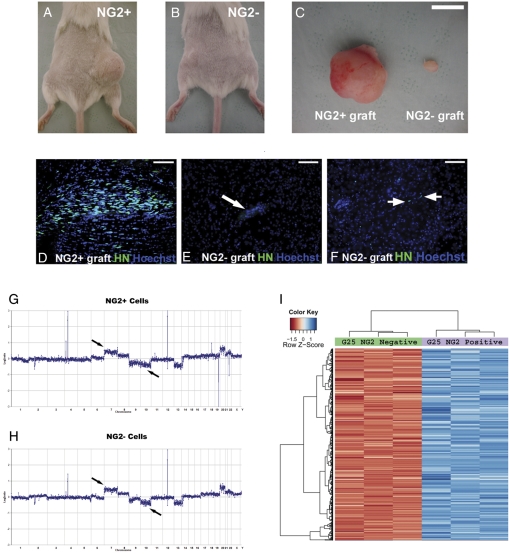
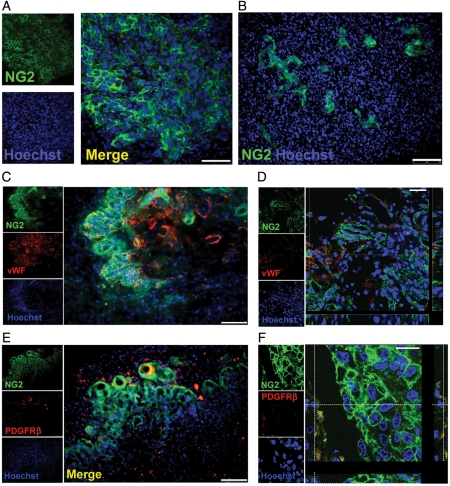
Glioblastoma multiforme (GBM) is the most common type of primary brain tumor and a highly malignant and heterogeneous cancer. Current conventional therapies fail to eradicate or curb GBM cell growth. Hence, exploring the cellular and molecular basis of GBM cell growth is vital to develop novel therapeutic approaches. Neuroglia (NG)-2 is a transmembrane proteoglycan expressed by NG2+ progenitors and is strongly linked to cell proliferation in the normal brain. By using NG2 as a biomarker we identify a GBM cell population (GBM NG2+ cells) with robust proliferative, clonogenic, and tumorigenic capacity. We show that a significant proportion (mean 83%) of cells proliferating in the tumor mass express NG2 and that over 50% of GBM NG2+ cells are proliferating. Compared with the GBM NG2- cells from the same tumor, the GBM of NG2+ cells overexpress genes associated with aggressive tumorigenicity, including overexpression of Mitosis and Cell Cycling Module genes (e.g., MELK, CDC, MCM, E2F), which have been previously shown to correlate with poor survival in GBM. We also show that the coexpression pattern of NG2 with other glial progenitor markers in GBM does not recapitulate that described in the normal brain. The expression of NG2 by such an aggressive and actively cycling GBM population combined with its location on the cell surface identifies this cell population as a potential therapeutic target in a subset of patients with GBM.
Figures


Similar articles
-
A non-hierarchical organization of tumorigenic NG2 cells in glioblastoma promoted by EGFR.Neuro Oncol. 2019 Jun 10;21(6):719-729. doi: 10.1093/neuonc/noy204. Neuro Oncol. 2019. PMID: 30590711 Free PMC article.
-
Progenitor/Stem Cell Markers in Brain Adjacent to Glioblastoma: GD3 Ganglioside and NG2 Proteoglycan Expression.J Neuropathol Exp Neurol. 2016 Feb;75(2):134-47. doi: 10.1093/jnen/nlv012. J Neuropathol Exp Neurol. 2016. PMID: 26792897
-
Targeting the NG2/CSPG4 proteoglycan retards tumour growth and angiogenesis in preclinical models of GBM and melanoma.PLoS One. 2011;6(7):e23062. doi: 10.1371/journal.pone.0023062. Epub 2011 Jul 29. PLoS One. 2011. PMID: 21829586 Free PMC article.
-
Ion channel expression and function in glioblastoma multiforme (GBM): pathophysiological mechanisms and therapeutic potential.Biochim Biophys Acta Mol Cell Res. 2025 Aug;1872(6):119982. doi: 10.1016/j.bbamcr.2025.119982. Epub 2025 May 5. Biochim Biophys Acta Mol Cell Res. 2025. PMID: 40328081 Review.
-
Applications of emerging molecular technologies in glioblastoma multiforme.Expert Rev Neurother. 2008 Oct;8(10):1497-506. doi: 10.1586/14737175.8.10.1497. Expert Rev Neurother. 2008. PMID: 18928343 Free PMC article. Review.
Cited by
-
NG2-cells are not the cell of origin for murine neurofibromatosis-1 (Nf1) optic glioma.Oncogene. 2014 Jan 16;33(3):289-99. doi: 10.1038/onc.2012.580. Epub 2013 Jan 14. Oncogene. 2014. PMID: 23318450 Free PMC article.
-
Chimeric antigen receptors for treatment of glioblastoma: a practical review of challenges and ways to overcome them.Cancer Gene Ther. 2017 Mar;24(3):121-129. doi: 10.1038/cgt.2016.46. Epub 2016 Oct 21. Cancer Gene Ther. 2017. PMID: 27767090 Review.
-
Myelination of the developing lateral olfactory tract and anterior commissure.J Comp Neurol. 2018 Aug 1;526(11):1843-1858. doi: 10.1002/cne.24452. Epub 2018 Apr 26. J Comp Neurol. 2018. PMID: 29665005 Free PMC article.
-
Targeting a Plk1-Controlled Polarity Checkpoint in Therapy-Resistant Glioblastoma-Propagating Cells.Cancer Res. 2015 Dec 15;75(24):5355-66. doi: 10.1158/0008-5472.CAN-14-3689. Epub 2015 Nov 16. Cancer Res. 2015. PMID: 26573800 Free PMC article.
-
NG2 proteoglycan-dependent recruitment of tumor macrophages promotes pericyte-endothelial cell interactions required for brain tumor vascularization.Oncoimmunology. 2015 Jan 22;4(4):e1001204. doi: 10.1080/2162402X.2014.1001204. eCollection 2015 Apr. Oncoimmunology. 2015. PMID: 26137396 Free PMC article.
References
-
- Stupp R, Mason WP, van den Bent MJ, et al. Radiotherapy plus concomitant and adjuvant temozolomide for glioblastoma. N Engl J Med. 2005;352(10):987–996. doi:10.1056/NEJMoa043330. - DOI - PubMed
-
- Stupp R, van den Bent MJ, Hegi ME. Optimal role of temozolomide in the treatment of malignant gliomas. Curr Neurol Neurosci Rep. 2005;5(3):198–206. doi:10.1007/s11910-005-0047-7. - DOI - PubMed
-
- Walker MD. The contemporary role of chemotherapy in the treatment of malignant brain tumor. Clin Neurosurg. 1978;25:388–396. - PubMed
-
- Walker MD, Alexander E, Jr., Hunt WE, et al. Evaluation of BCNU and/or radiotherapy in the treatment of anaplastic gliomas. A cooperative clinical trial. J Neurosurg. 1978;49(3):333–343. - PubMed
-
- Hegi ME, Diserens AC, Gorlia T, et al. MGMT gene silencing and benefit from temozolomide in glioblastoma. N Engl J Med. 2005;352(10):997–1003. doi:10.1056/NEJMoa043331. - DOI - PubMed
Publication types
MeSH terms
Substances
Grants and funding
LinkOut - more resources
Full Text Sources
Medical
Miscellaneous
