

doi: 10.1093/neuonc/nor071.
Gene-protein correlation in single cells
Affiliations
- PMID: 21798849
- PMCID: PMC3145472
- DOI: 10.1093/neuonc/nor071
Item in Clipboard
Gene-protein correlation in single cells
Neuro Oncol.
2011 Aug.
Abstract
We present a novel methodology combining traditional fluorescent in situ hybridization with an in situ protein detection technology called proximity ligation assay. This method has potential to perform a detailed analysis of the relationship between gene status and corresponding protein expression in cells and tissues. We demonstrate that the fluorescent in situ gene protein assay methodology is capable of resolving gene and protein patterns simultaneously on a cell-by-cell basis.
Figures
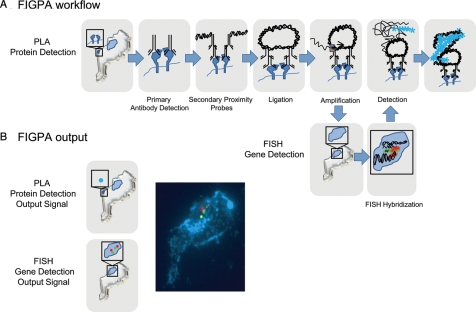
(A) Workflow of FIGPA. FIGPA begins with protein detection by performing PLA. Antibodies recognizing the target of interest are added and that signal is amplified through PCR of linked, tethered nucleic acids. The tissue samples are additionally fixed in 4% paraformaldehyde and digested with pepsin. The genetic detection then takes place as the samples are dehydrated and hybridized overnight with the FISH probe. After washing, the PLA detection probe, complementary to the PCR amplification product, is added. (B) The output of FIGPA consists of the combined protein detection signals (blue dots) and genetic detection signals (green and red dots). These outputs are visualized with a fluorescent microscope.
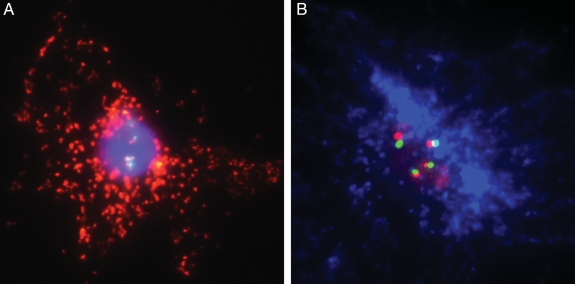
FIGPA in fixed human tumor cells. (A) FIGPA in U87 glioblastoma cells transfected with EGFRvIII. Proximate green (Spectrum Green) and red (Spectrum Orange) signals represent the centromere of chromosome 7 and the EGFR gene locus, respectively; the cytoplasmic red dots (563-nm dye) visualize the EGFRvIII protein. The nucleus is counterstained with Hoechst 33342. (B) Use of Pacific Blue protein detection dye (455 nm) in place of red 563-nm dye. All magnifications ×400.
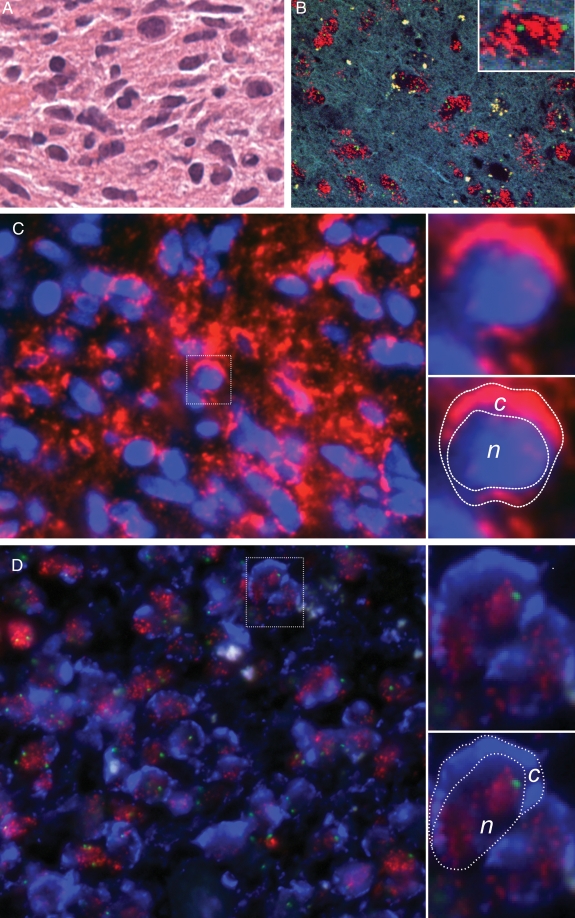
FIGPA in paraffin-embedded tumor tissue. (A) Hematoxylin-and-eosin stain of glioblastoma sample. (B) FISH probe targeted for EGFR gene locus at chromosome 7p12 (red dots) and centromere of chromosome 7 (green dots). Insert: single cell nucleus showing this tumor to be highly amplified for EGFR at the genetic level. (C) PLA reliably captures EGFR protein expression at the cytoplasmic cell membrane and the cytoplasm. Nucleus counterstained with Hoechst 33342. Top, right insert: single cell with EGFR protein overexpression. Bottom, right insert: same cell as above with demarcated cytoplasmic (c) and nuclear (n) compartments. (D) Same tumor analyzed via FIGPA (green and red signals represent the FISH probes denoting the centromere of chromosome 7 and the EGFR gene locus, and Pacific Blue dye denotes EGFR protein expression), demonstrating that the EGFR gene is amplified and that EGFR protein expression is concordantly elevated. The protein signal captured via Pacific Blue protein detection dye (455 nm) shows a similar pattern as the protein signal captured via red dye (563 nm) in Panel c. Top, right insert: single cell with amplified EGFR gene locus and EGFR protein overexpression. Bottom, right insert: same cell as above with demarcated cytoplasmic (c) and nuclear (n) compartments. All magnifications ×400.
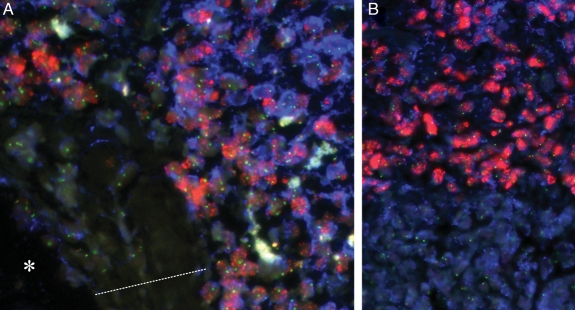
FIGPA captures tissue heterogeneity. (A) Tumor section near a tumor blood vessel highlights the specificity of FIGPA by revealing that EGFR amplification is confined to tumor cells and EGFR protein expression is high in tumor cells but virtually absent in cells of the tumor vessel wall. Asterisk (*) denotes the tumor vessel lumen, and the dotted line indicates the vessel wall. (B) Molecular heterogeneity within a glioblastoma tumor with one tumor cell population showing EGFR amplification and EGFR protein overexpression, and one population showing EGFR wild-type status. Green and red signals represent the FISH probes denoting the centromere of chromosome 7 and the EGFR gene locus, and Pacific Blue dye denotes EGFR protein expression. All magnifications ×400.
References
-
- Soderberg O, Gullberg M, Jarvius M, et al. Direct observation of individual endogenous protein complexes in situ by proximity ligation. Nat Methods. 2006;3:995–1000. doi:10.1038/nmeth947. - DOI - PubMed
-
- Soderberg O, Leuchowius KJ, Gullberg M, et al. Characterizing proteins and their interactions in cells and tissues using the in situ proximity ligation assay. Methods. 2008;45:227–232. doi:10.1016/j.ymeth.2008.06.014. - DOI - PubMed
-
- Yadav AK, Renfrow JJ, Scholtens DM, et al. Monosomy of chromosome 10 associated with dysregulation of epidermal growth factor signaling in glioblastomas. JAMA. 2009;302:276–289. doi:10.1001/jama.2009.1022. - DOI - PMC - PubMed
-
- Dacic S, Flanagan M, Cieply K, et al. Significance of EGFR protein expression and gene amplification in non–small cell lung carcinoma. Am J Clin Pathol. 2006;125:860–865. doi:10.1309/H5UW6CPCWWC92241. - DOI - PubMed
-
- Hirsch FR, Varella-Garcia M, Bunn PA, Jr, et al. Epidermal growth factor receptor in non–small-cell lung carcinomas: correlation between gene copy number and protein expression and impact on prognosis. J Clin Oncol. 2003;21:3798–3807. doi:10.1200/JCO.2003.11.069. - DOI - PubMed
Publication types
MeSH terms
Substances
LinkOut - more resources
Full Text Sources
Medical
Research Materials
Miscellaneous
