

Review
doi: 10.1126/science.1208859.
The outlook for population growth
Affiliations
- PMID: 21798936
- PMCID: PMC3155613
- DOI: 10.1126/science.1208859
Item in Clipboard
Review
The outlook for population growth
Science.
.
Abstract
Projections of population size, growth rates, and age distribution, although extending to distant horizons, shape policies today for the economy, environment, and government programs such as public pensions and health care. The projections can lead to costly policy adjustments, which in turn can cause political and economic turmoil. The United Nations projects global population to grow from about 7 billion today to 9.3 billion in 2050 and 10.1 billion in 2100, while the Old Age Dependency Ratio doubles by 2050 and triples by 2100. How are such population projections made, and how certain can we be about the trends they foresee?
Figures
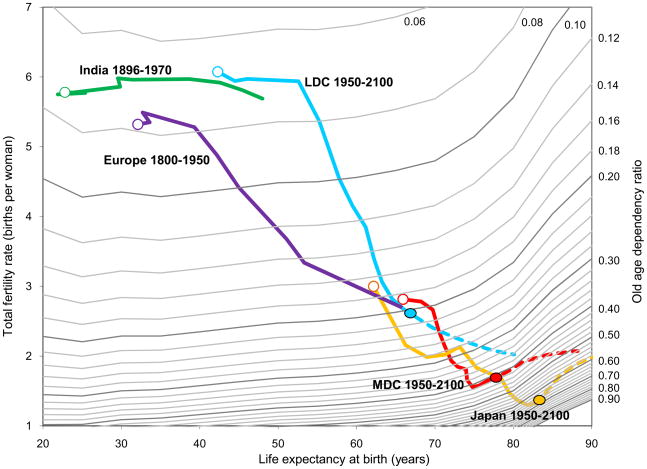
Fertility (TFR) and life expectancy (e0) decline across the demographic transition, and the old age dependency ratios (OADR) that they generate rise. The solid colored lines show historical data, starting with an empty circle at the first available year and ending in 2010 with a colored circle. The dashed lines show projected trajectories. The purple line for Europe represents the earlier experience of the MDC (red line). The green line for India represents the earlier experience of LDC (blue line). The black and gray contour lines show the combinations of fertility and mortality for which the OADR is constant in a steady state (stable) population. Historical data from 1950 to 2010 and forecasts from 2010 to 2100 are from U.N. (5). Prior to 1950, data for India are taken from (31). Data for Europe prior to 1950 are based on estimates in Tables 6.2–6.5 in (32) for the period 1800–1900, and (33) for the period 1900–1950. The OADR contours are derived from (34) using the Model West Female life table with mean age of childbearing at 29.
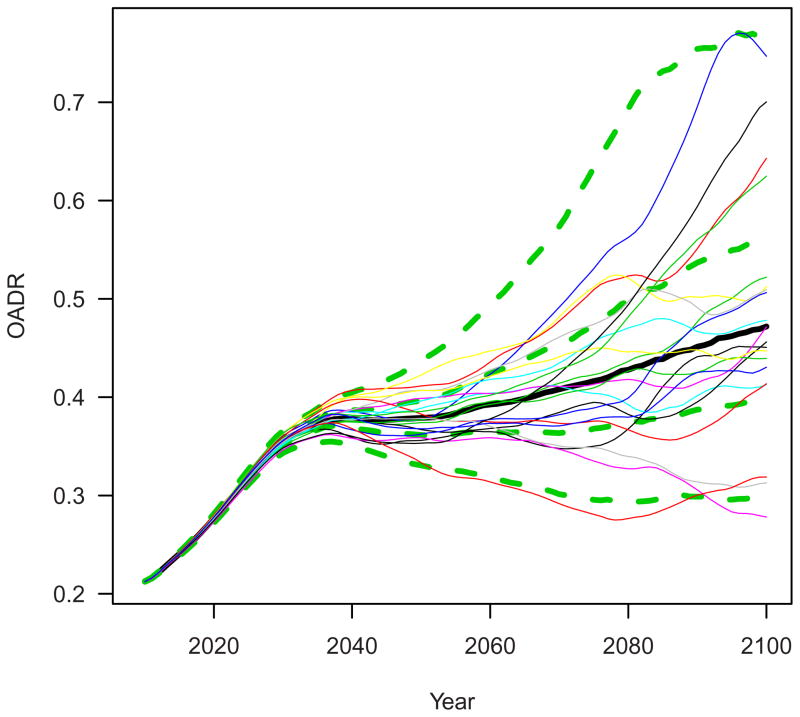
Forecasts of the United States OADR, 2010–2100, based on the time series method and stochastic simulation. Each of the twenty thin lines shows a single stochastic sample path, calculated for each year based on the prior years and by a random variable which, together with the given model of the fertility process, generates that year’s value, and similarly for mortality for which an independent random variable is drawn. The actual forecast is based on one thousand sample paths of this sort. The heavy black line is the median of these in each year, and the green dashed lines show the upper and lower 95% and 50% probability bound. The particular stochastic mortality model used in these forecasts is based on (35) and takes into account common features of the mortality histories of fifteen low mortality industrial nations, including thirteen European populations and Japan as well as the US. The fertility model is similar to that in (25).
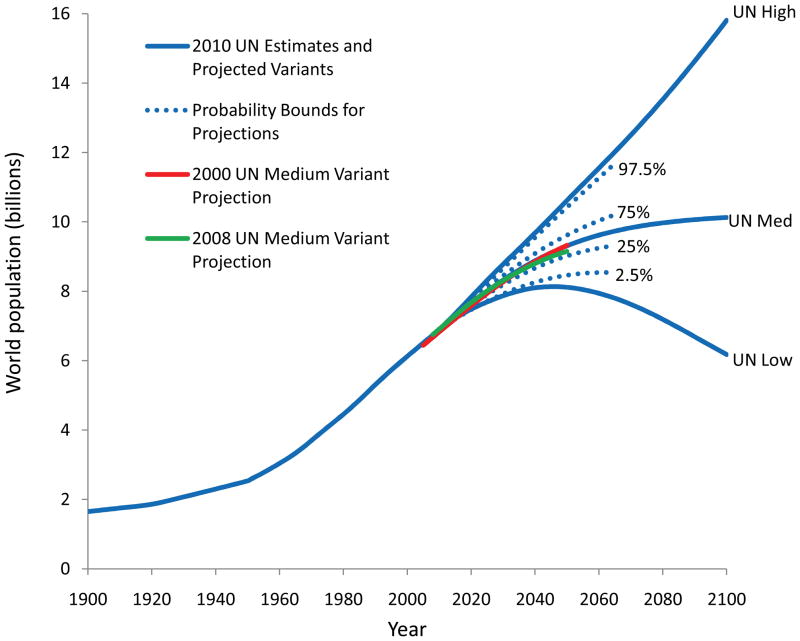
United Nations (2011) estimates and projections of world population with High, Medium and Low variants (solid blue lines) and with probability intervals. Mortality is the same in all variants, but fertility is higher or lower by .5 births per woman in the variants. The dotted blue lines represent 95% and 50% probability intervals based on the ex post analysis of U.N. projections done between 1973, 1980, 1984, and 1994 as reported in National Research Council (20) and its appendices. The red line is the Medium UN projection in the 2000 Revision, and the green line is the Medium projection in the 2008 revision, both to 2050. The population from 1900 to 1940 is from (36).
Comment in
-
Breathing life into mortality data collection.Science. 2011 Sep 23;333(6050):1702. doi: 10.1126/science.333.6050.1702-a. Science. 2011. PMID: 21940876 No abstract available.
References
-
- Malthus T. In: An Essay on the Principle of Population. 1. Flew Antony., editor. Penguin English Library; London: 1970. p. 1798.
-
- Boserup E. Population and Technological Change. University of Chicago Press; Chicago: 1981.
-
- Cohen JE. How Many People Can the Earth Support? WW. Norton; New York, NY: 1995.
-
- Becker G, Murphy KM, Tamura RT. Human capital, fertility, and economic growth. J Polit Econ. 1990;98(Part II):S12–S37.
-
- United Nations. World Population Prospects: The 2010 Revision, Vol. 1, Comprehensive Tables. New York: United Nations; 2011. [Accessed on May 10, 2011. ]. http://esa.un.org/unpd/wpp/index.htm.
Publication types
MeSH terms
Grants and funding
LinkOut - more resources
Full Text Sources
Other Literature Sources
