. 2011 Jul 29;333(6042):642-6.
doi: 10.1126/science.1207339.

RNA mimics of green fluorescent protein

Affiliations

RNA mimics of green fluorescent protein

Jeremy S Paige et al. Science. .

Abstract

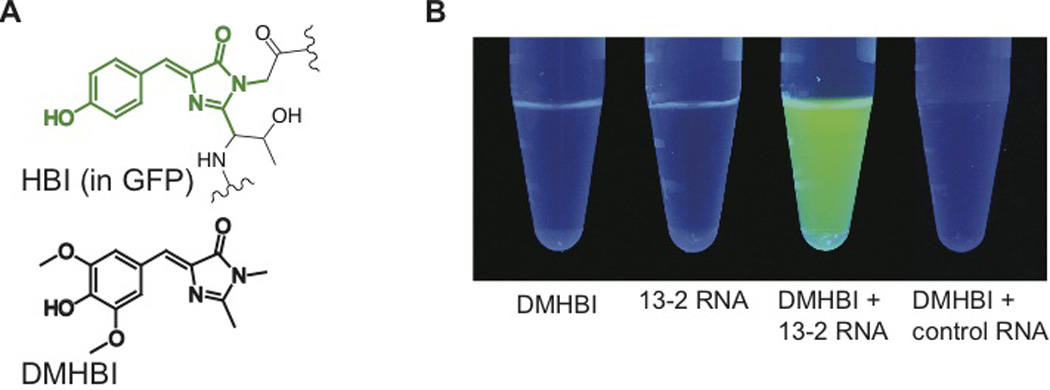
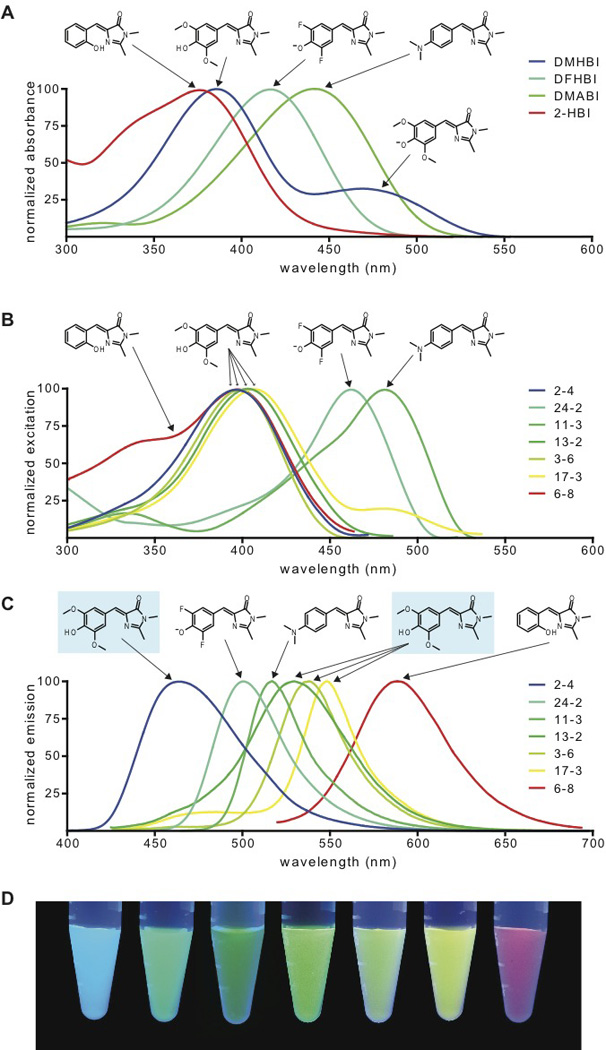
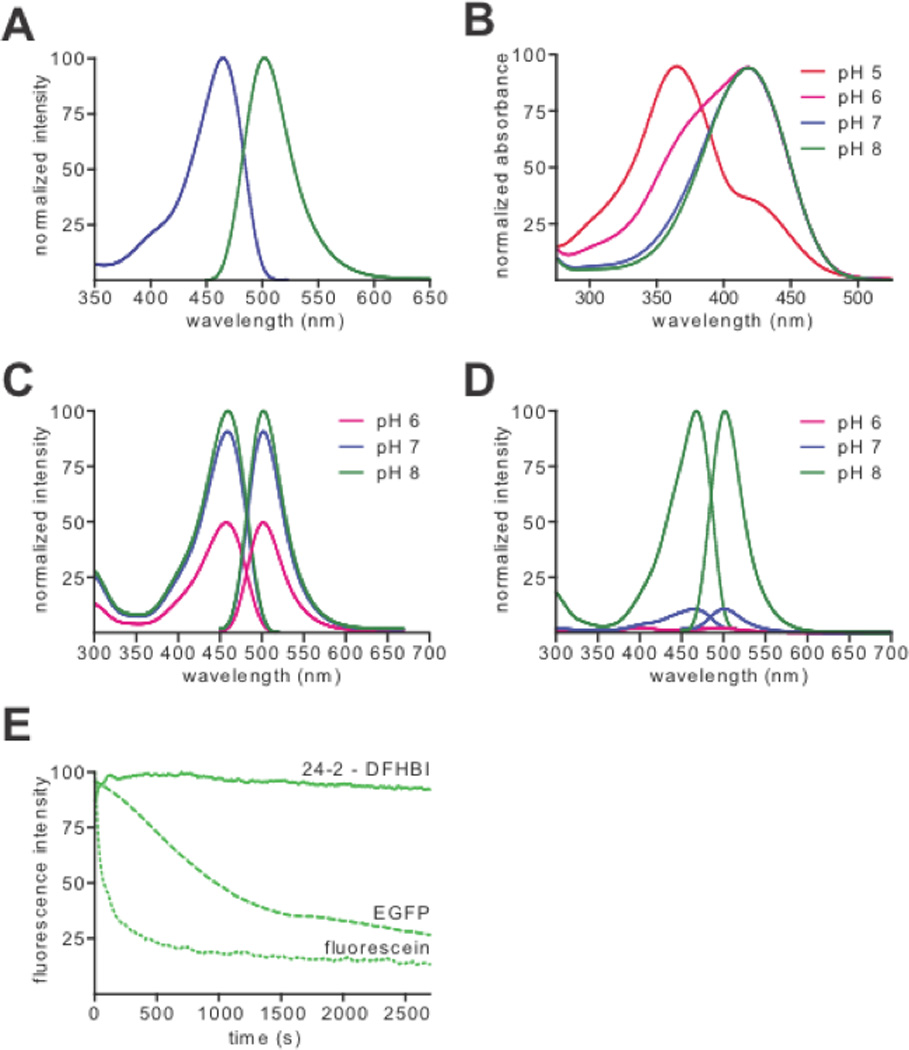
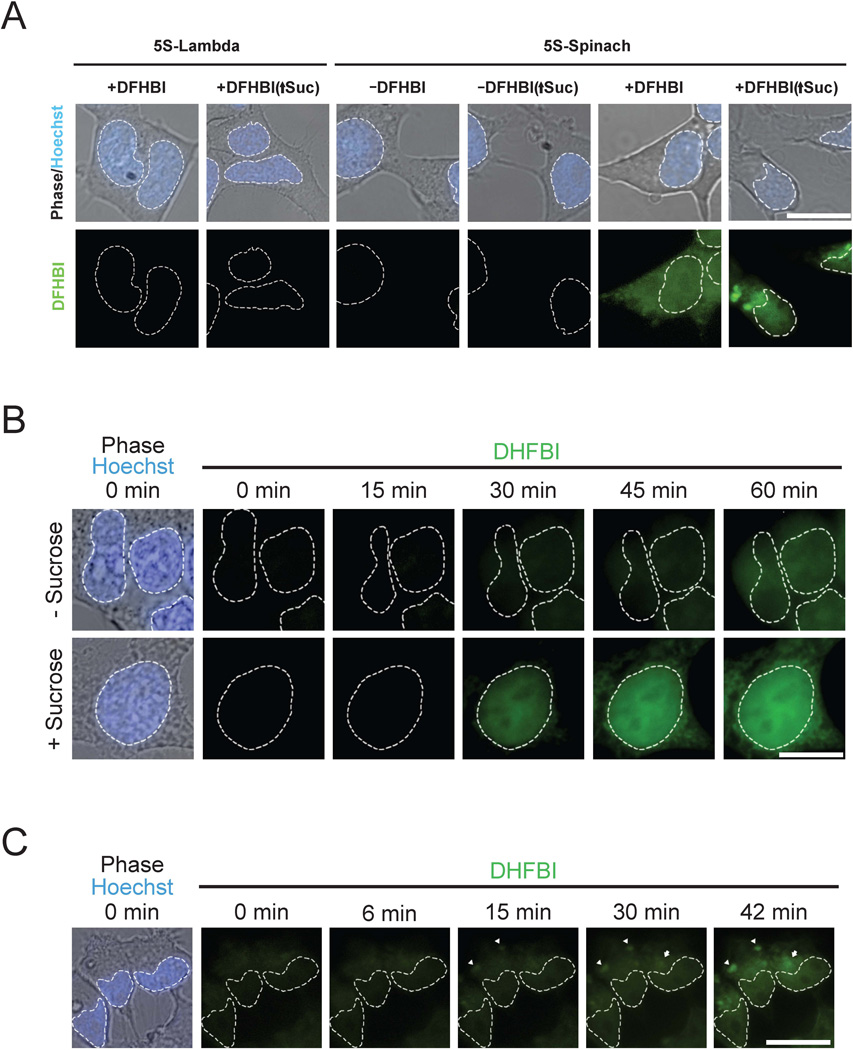
Green fluorescent protein (GFP) and its derivatives have transformed the use and analysis of proteins for diverse applications. Like proteins, RNA has complex roles in cellular function and is increasingly used for various applications, but a comparable approach for fluorescently tagging RNA is lacking. Here, we describe the generation of RNA aptamers that bind fluorophores resembling the fluorophore in GFP. These RNA-fluorophore complexes create a palette that spans the visible spectrum. An RNA-fluorophore complex, termed Spinach, resembles enhanced GFP and emits a green fluorescence comparable in brightness with fluorescent proteins. Spinach is markedly resistant to photobleaching, and Spinach fusion RNAs can be imaged in living cells. These RNA mimics of GFP provide an approach for genetic encoding of fluorescent RNAs.


Figures

Fig. 1
Fig. 1. RNA aptamers switch on the fluorescence of GFP-like fluorophores
(A) Structure of HBI (green) in the context of GFP, and DMHBI. (B) 13-2 enhances the fluorescence of DMHBI. Solutions containing DMHBI, 13-2 RNA, DMHBI with 13-2 RNA, or DMHBI with total HeLa cell RNA were photographed under illumination with 365 nm light. The image is a montage obtained under identical image acquisition conditions.
Fig. 2
Fig. 2. Spectral tuning and fluorophore diversity produce a palette of RNA-fluorophore complexes
(A) Absorbance spectra of GFP-like fluorophores. Spectra were collected in the absence of RNA at pH 7.4. (B,C) Excitation (B) and emission (C) spectra of RNA-fluorophore complexes. Spectra were collected in the presence of excess fluorophore at pH 7.4 for RNAs binding to DMHBI (2–4, 13-2, 3–6 and 17-3), DFHBI (24-2), DMABI (11-3) and 2-HBI (6–8). Spectra are normalized to the excitation and emission peak for each complex. Arrows indicate the fluorophore from which each spectrum is derived. For emission spectra (C), DMHBI is indicated by blue shading. (D) RNA-fluorophore complexes were illuminated with UV light (365 nm) and photographed. From left to right, the tubes contain RNAs 2–4, 24-2, 11-3, 13-2, 3–6, 17-3, 6–8 and fluorophores as indicated above. The image is a montage obtained under identical image acquisition conditions.
Fig. 3
Fig. 3. RNA-fluorophore complexes with EGFP-like properties
(A) Normalized excitation (blue) and emission (green) spectra of 24-2-DFHBI complex. (B) Normalized absorbance spectra of DFHBI at pHs 5.0, 6.0, 7.0 and 8.0. (C,D) 24-2 incubated with excess DFHBI (C) or HBI (D) at pHs 6.0, 7.0 and 8.0. (E) Photobleaching curves for 24-2-DFHBI, EGFP and fluorescein. Fluorophores were immobilized on glass slides and illuminated continuously with a 130 W mercury lamp. Total fluorescence was then plotted against exposure time and normalized to the maximum intensity of each fluorophore.
Fig. 4
Fig. 4. Live cell imaging of Spinach fusion RNAs
(A) Live cell imaging of Spinach-tagged 5S RNA. Fluorescence and phase images of HEK293T cells expressing 5S tagged with either Spinach or Lamda, a control RNA. Fluorescence is detected in 5S-Spinach expressing cells in the presence of 20 µM DFHBI, with granule formation present in cells treated with 600 mM sucrose for 30 min (↑Suc). White dashed lines indicate nuclear borders assessed by Hoescht 33342 staining. (B) 5S-Spinach RNA induction in response to stress. 5S-Spinach-expressing HEK293T cells were pretreated with 30 nM ML-60128 for 16 hours and then treated with vehicle or 600 mM sucrose for 60 min. Treatment of cells with sucrose resulted in a rapid induction of 5S-Spinach RNA and an increase in total 5S-Spinach levels compared to control cells. (C) 5S-Spinach RNA localization into granules. 5S-Spinach-expressing HEK293T cells were stimulated with 600 mM sucrose to monitor the rate of formation of 5S-Spinach-containing granules. Arrowheads indicate granules that formed earliest, and arrows indicate granules that developed later during the time course of treatment. Scale bar, 10 µm.

References

    1. Chudakov DM, Matz MV, Lukyanov S, Lukyanov KA. Fluorescent Proteins and Their Applications in Imaging Living Cells and Tissues. Physiol. Rev. 2010;90:1103. - PubMed
    1. Niwa H, et al. Chemical nature of the light emitter of the Aequorea green fluorescent protein. Proc Natl Acad Sci USA. 1996;93:13617. - PMC - PubMed
    1. Ward WW, Bokman SH. Reversible denaturation of Aequorea green-fluorescent protein: physical separation and characterization of the renatured protein. Biochemistry (Mosc) 1982;21:4535. - PubMed
    1. Meech S. Excited state reactions in fluorescent proteins. Chem. Soc. Rev. 2009 - PubMed
    1. Babendure J, Adams S, Tsien R. Aptamers switch on fluorescence of triphenylmethane dyes. J. Am. Chem. Soc. 2003;125:14716. - PubMed

Publication types

MeSH terms