. 2011 Sep 23;286(38):33544-56.
doi: 10.1074/jbc.M111.220087. Epub 2011 Jul 28.

Conformational regulation of urokinase receptor function: impact of receptor occupancy and epitope-mapped monoclonal antibodies on lamellipodia induction

Affiliations

Conformational regulation of urokinase receptor function: impact of receptor occupancy and epitope-mapped monoclonal antibodies on lamellipodia induction

Henrik Gårdsvoll et al. J Biol Chem. .

Abstract

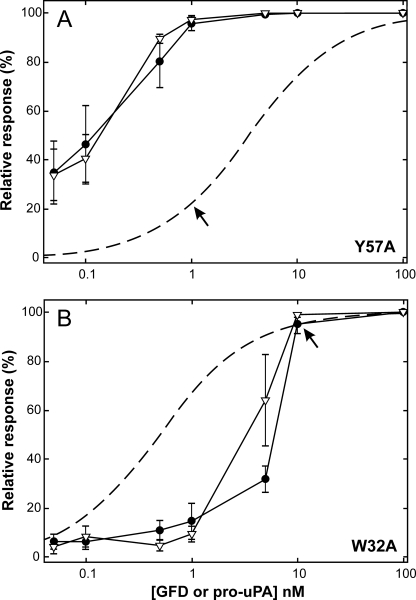
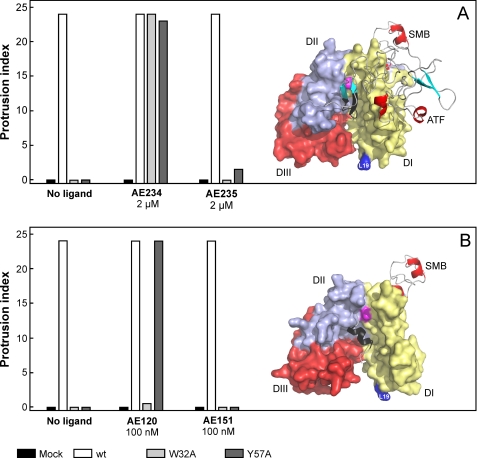
The urokinase-type plasminogen activator receptor (uPAR) is a glycolipid-anchored membrane protein with an established role in focalizing uPA-mediated plasminogen activation on cell surfaces. Distinct from this function, uPAR also modulates cell adhesion and migration on vitronectin-rich matrices. Although uPA and vitronectin engage structurally distinct binding sites on uPAR, they nonetheless cooperate functionally, as uPA binding potentiates uPAR-dependent induction of lamellipodia on vitronectin matrices. We now present data advancing the possibility that it is the burial of the β-hairpin in uPA per se into the hydrophobic ligand binding cavity of uPAR that modulates the function of this receptor. Based on these data, we now propose a model in which the inherent interdomain mobility in uPAR plays a major role in modulating its function. Particularly one uPAR conformation, which is stabilized by engagement of the β-hairpin in uPA, favors the proper assembly of an active, compact receptor structure that stimulates lamellipodia induction on vitronectin. This molecular model has wide implications for drug development targeting uPAR function.


Figures

FIGURE 1.
FIGURE 1.
Regulation of uPAR-dependent lamellipodia formation on vitronectin by uPA ligation. Panel A shows representative micrographs of transfected HEK293 cells expressing high levels of either uPARwt, uPARW32A, or uPARY57A that are plated on a reconstituted vitronectin matrix for 24 h in the presence or absence of 100 nm concentrations of the stated uPA-derivatives. To enhance detection of lamellipodia, cells were fixed, permeabilized, and stained with Alexa 488-labeled phalloidin before micrographs were taken in a fluorescence microscope. Note the absence of lamellipodia in HEK293 cells expressing either uPARW32A or uPARY57A and the reappearance of these structures after the addition of uPA or GFD. Panel B shows an unbiased semiquantitative assessment of the induction of lamellipodia in these cells using the protocol outlined under “Materials and Methods.”
FIGURE 2.
FIGURE 2.
Dose-response curve for GFD and pro-uPAS356A-induced lamellipodia in HEK293 cells transfected with uPARY57A or uPARW32A. Two stably transfected HEK293 cell lines were stimulated with different levels of GFD (▿) or pro-uPAS356A (●), ranging from 0.05 to 100 nm for 24 h, and protrusion indices were subsequently evaluated as outlined under “Material and Methods.” Data shown represent the mean of 6–8 independent experiments for each concentration of added ligand (bars indicate S.E.). To allow direct comparison to ligand occupancy, the protrusion index is depicted as relative scores. The theoretical saturation curves for uPARW32A and uPARY57A (dashed curves) are calculated based on the KD values previously determined by surface plasmon resonance, 0.5 and 3.5 nm, respectively (34). These graphs reveal that HEK293 cells expressing uPARY57A require only ∼20% ligand saturation to accomplish a complete protrusion score (i.e. at 1 nm ligand), whereas cells expressing uPARW32A require 90–95% ligand saturation (i.e. at 10 nm ligand) as indicated by arrows. It is also clear from these experiments that GFD is just as efficient as pro-uPA in stimulating uPAR-dependent protrusions.
FIGURE 3.
FIGURE 3.
Estimation of IC50 values for low molecular weight antagonists of the uPA-uPAR interaction. Panel A shows the linear relationship of the association rate of uPAR (vobs; 10−18 mol/s per mm2) to a high density of immobilized pro-uPAS356A (5800 RU ∼ 0.13 × 10⁻¹² mol/mm2) as a function of the analyzed uPAR concentration (0.5–0.0008 nm). The SDS-PAGE analysis to the left shows the quality of the purified proteins after reduction and alkylation, whereas the raw sensorgrams recorded by surface plasmon resonance for the interaction of a serial 2-fold dilution of uPAR starting at 1 nm are shown to the right. The reproducibility of this data set is illustrated by the repeat analysis of 0.5 nm uPAR at the end of the experiment (shown in blue). vobs was calculated as ΔRU/s from 280 to 415 s and was converted to mol/s assuming that 1 RU ∼ 1 pg/mm2. Panel B shows the competition profile for 0.5 nm uPAR binding to immobilized pro-uPAS356A by a serial 3-fold dilution of the linear peptide antagonist AE120 (300–0.005 nm). The efficacy of the obtained inhibition is visualized by the recorded sensorgrams, and the quality of the data is demonstrated by the repeat analysis of 0.5 nm uPAR without competitor (blue curve). The green curves in A and B are buffer runs. Panel C, the residual levels of unoccupied uPAR in the presence of various concentrations of peptide antagonists were subsequently calculated from recorded vobs (as exemplified for AE120 in B) and the corresponding standard curves (A). The resulting inhibition profiles are shown along with their four-parameter logistic fits for GFD, a cyclic decapeptide derived from the β-hairpin of GFD (AE234) and its scrambled control (AE235), a linear nonapeptide antagonist (AE105), as well as a pseudosymmetrical analog (AE120) and its scrambled control (AE151). The derived IC50 values are shown in Table 1. suPAR, soluble uPAR.
FIGURE 4.
FIGURE 4.
Two different peptide antagonists behave differently as surrogates for stimulation of uPAR-dependent lamellipodia formation. Panel A shows that 2 μm AE234 is capable of inducing robust lamellipodia formation in HEK293 cell lines transfected with uPARW32A or uPARY57A. A scrambled, non-binding version of this peptide (AE235) does not induce this phenomenon. AE234 is a cyclic peptide surrogate of the receptor binding β-hairpin in uPA, where it mimics the region comprising residues 21–30 (shown in black in the model). This region of uPA is almost completely buried in the ATF-uPAR-SMB complex (17). In this schematic, uPAR is shown in a surface representation (DI, yellow; DII, light blue; DIII, red), whereas ATF and SMB are shown as ribbon representations. The position of Leu19 in uPAR is highlighted (blue) to facilitate comparison with data shown in Figs. 5 and 6. Panel B shows that AE120 only is capable of inducing lamellipodia in HEK293 cells transfected with uPARY57A, whereas HEK293 cells expressing uPARW32A are refractory to this stimulation. Its scrambled non-binding version (AE151) is inactive in both transfectants. AE120 is a linear peptide antagonist of the uPA-uPAR interaction, and the crystal structure of uPAR in complex with a truncated analog of AE120 (15) reveals that this antagonist engages the same region as the receptor binding β-hairpin in uPA (see the model). Nevertheless, it stabilizes a notably more open conformation of uPAR relative to that stabilized by ATF. The SMB is added in this schematic merely to illustrate the position of the vitronectin-binding epitope on uPAR. The position of Tyr57 in the central ligand binding cavity at the DI-DII interface is shown in magenta in both figures.
FIGURE 5.
FIGURE 5.
Defining the site 1 epitope bin in uPAR DI. The data shown in panel A for mAb R21 highlight the location of one of two dominating immunogenic hotspots on DI in intact uPAR (site 1). The interaction between immobilized mAb R21 and a serial 2-fold dilution series of purified human recombinant uPAR mutants (range 6–200 nm) was measured by surface plasmon resonance (Biacore 3000TM). The determined dissociation rate constants (koff) are shown (n = 6) as a function of the positions in the primary sequence of human uPAR DI1–87 that were mutated individually to alanine (omitting positions occupied by cysteines). Secondary structure elements of uPAR DI are shown in the upper section following a previously established nomenclature (15), whereas the primary sequence of DI is shown at the bottom along with the disulfide connectivity and the sequence conservation relative to mouse uPAR (asterisks represent identical residues). The molecular model shown to the left visualizes the location of the hotspot binding site for R21 (i.e. Thr59, Gly60, Leu61, and Lys62, colored blue) relative to the binding sites of the two bona fide ligands using the PDB accession code 3BT1. Bound uPA (represented by ATF) and vitronectin (represented by SMB) are both shown as ribbon diagrams, whereas uPAR is shown in a surface representation with DI, DII, and DIII colored yellow, light blue, and red. The sensorgrams in panel B show that uPAR bound to immobilized R21 is unable to bind 200 nm concentrations of either ATF or GFD (red curves), whereas uPAR bound to immobilized R2, analyzed in parallel and shown for comparison, displays an uncompromised GFD binding (blue curve). The black curves represent binary uPAR-R21 and uPAR-R2 complexes. Panel C shows that uPAR bound to immobilized R21 binds neither 200 nm ATF nor the SMB domain of vitronectin (tested in 2-fold dilution series ranging from 0.1 to 9 μm). As a positive control, the corresponding interactions with uPAR immobilized on mAb R2 were measured in parallel in another flow cell (red curve R2-uPAR and blue curve R2-uPAR-ATF) yielding a KD of 1.8 ± 0.2 μm for the interaction between SMB and R2-uPAR (inset).
FIGURE 6.
FIGURE 6.
Defining the site 2 epitope bin in uPAR DI. Data shown for mAb mR1, recognizing the second dominating immunogenic epitope (site 2), are shown in A. This panel is organized as in Fig. 5 except that the molecular model for ATF-uPAR-SMB is rotated 180° horizontally as illustrated. The hotspot for mR1 binding is shown in blue, and that for the DIII-reactive mAb R2 is shown in cyan for comparison. The sensorgrams in panel B show that uPAR bound to immobilized mR1 does indeed bind the uPA derivatives ATF (red curve) and GFD (blue curve) when these are injected at 200 nm. The formed ternary complexes are, however, relatively more unstable than the binary uPAR-mR1 complex (black curve), leading to a roughly 15-fold increase in the apparent koff for ATF-uPAR-mR1, 25-fold for GFD-uPAR-mR1, and 3-fold for AE234-uPAR-mR1 (data not shown) during injection of the respective ligands at saturating conditions (B). The sensorgrams in panel C show that SMB does bind uPAR-mR1complexes, but this occurs with a moderately decreased affinity (KD is 4.4 ± 0.5 μm) as compared to that measured for uPAR-R2 complexes measured in parallel (KD is 1.8 ± 0.2 μm), as derived from the equilibrium binding isotherms shown in the inset.
FIGURE 7.
FIGURE 7.
Effect of various epitope-mapped anti-uPAR monoclonal antibodies on lamellipodia formation. The inhibitory effect of various monoclonal antibodies on uPAR-induced lamellipodia is shown as bar diagrams. In panel A these mAbs were added at a final concentration of 15 μg/ml (∼100 nm) to uPARwt-transfected HEK293 cells already firmly adherent to the vitronectin-coated coverslips. Protrusions were scored 24 h after the addition of the respective mAbs. Identical results were obtained if these mAbs were added during cell seeding (not shown). In panel B, uPARW32A-transfected HEK293 cells were primed to adhere to the vitronectin-coated coverslips by seeding in the presence of 20 nm GFD for 24 h. mAbs representing the different epitope bins (R21, mR1, and R2) were added at a final concentration of 15 μg/ml (∼100 nm) in the presence of 20 nm GFD, and incubation proceeded for an additional 24 h before protrusions were scored. Each bar represents the mean value of four independent measurements. The micrographs show representative appearances of the evaluated HEK293 cells.
FIGURE 8.
FIGURE 8.
Conformational switch in uPAR regulating lamellipodia formation. This figure schematically depicts the model we propose for ligand-induced regulation of uPAR-mediated lamellipodia formation on vitronectin-rich matrices. We postulate that there is a considerable inherent conformational flexibility in the multidomain assembly of the three homologous LU domains in uPAR, enabling the receptor to explore different conformational states. The equilibrium between these states is sensitive to mutations as well as engagement of different mAbs and ligands as indicated in the figure. The open conformation is inferred from our functional biochemical data, whereas the intermediate and closed conformations are confirmed by x-ray crystal structures of AE147-uPAR (PDB accession code 1YWH) and ATF-uPAR (PDB accession code 2FD6), respectively. The location of Tyr57 at the DI-DII interface is indicated in magenta. Vn, vitronectin.

References

    1. Friedl P., Gilmour D. (2009) Nat. Rev. Mol. Cell Biol. 10, 445–457 - PubMed
    1. Friedl P., Wolf K. (2009) Cancer Metastasis Rev. 28, 129–135 - PubMed
    1. Rozario T., DeSimone D. W. (2010) Dev. Biol. 341, 126–140 - PMC - PubMed
    1. Smith H. W., Marshall C. J. (2010) Nat. Rev. Mol. Cell Biol. 11, 23–36 - PubMed
    1. Kjaergaard M., Hansen L. V., Jacobsen B., Gårdsvoll H., Ploug M. (2008) Front. Biosci. 13, 5441–5461 - PubMed

Publication types

MeSH terms