. 2011 Sep 15;71(18):6019-29.
doi: 10.1158/0008-5472.CAN-11-1417. Epub 2011 Jul 28.

Taxane-induced blockade to nuclear accumulation of the androgen receptor predicts clinical responses in metastatic prostate cancer

Affiliations

Taxane-induced blockade to nuclear accumulation of the androgen receptor predicts clinical responses in metastatic prostate cancer

Medha S Darshan et al. Cancer Res. .

Abstract

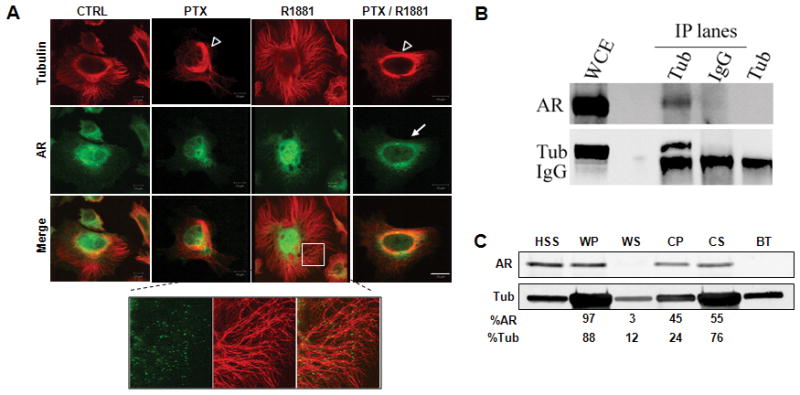
Prostate cancer progression requires active androgen receptor (AR) signaling which occurs following translocation of AR from the cytoplasm to the nucleus. Chemotherapy with taxanes improves survival in patients with castrate resistant prostate cancer (CRPC). Taxanes induce microtubule stabilization, mitotic arrest, and apoptotic cell death, but recent data suggest that taxanes can also affect AR signaling. Here, we report that taxanes inhibit ligand-induced AR nuclear translocation and downstream transcriptional activation of AR target genes such as prostate-specific antigen. AR nuclear translocation was not inhibited in cells with acquired β-tubulin mutations that prevent taxane-induced microtubule stabilization, confirming a role for microtubules in AR trafficking. Upon ligand activation, AR associated with the minus-end-microtubule motor dynein, thereby trafficking on microtubules to translocate to the nucleus. Analysis of circulating tumor cells (CTC) isolated from the peripheral blood of CRPC patients receiving taxane chemotherapy revealed a significant correlation between AR cytoplasmic sequestration and clinical response to therapy. These results indicate that taxanes act in CRPC patients at least in part by inhibiting AR nuclear transport and signaling. Further, they suggest that monitoring AR subcellular localization in the CTCs of CRPC patients might predict clinical responses to taxane chemotherapy.


Figures

Figure 1
Figure 1. Taxane treatment impairs AR nuclear accumulation
(A) LNCaP cells were treated with DMSO (vehicle control) or paclitaxel (PTX) 100 nM overnight followed by 1 h treatment with the synthetic DHT analog R1881 (1 nM) to induce AR nuclear translocation. Cells were fixed and immunostained with antibodies against AR (green) and total tubulin (red) and imaged by confocal microscopy. Left panel: overlay of tubulin and AR, middle panel: AR alone, right panel: representative high magnification images of tubulin and AR. Solid arrows: AR nuclear localization in R1881 panel, Dashed arrow: AR cytoplasmic sequestration and reduced nuclear accumulation, Arrowheads: microtubule bundles. (B) Quantitative analysis of number of cells with AR nuclear staining. (C) Quantitation of relative AR nuclear fluorescence intensity. (D) Dynamics and quantitation of AR nuclear accumulation using live cell imaging of PC3:mCherry-Tub cells microinjected with GFP-AR and treated with 1nM R1881 in the absence or presence of 13M PTX. Upper panel: Time lapse images were obtained with a spinning disk confocal microscope by acquiring an entire Z-stack at 10 min intervals for 2 hr. Shown are maximum intensity projections of representative PC3:mCherry-Tub cells expressing full-length GFP-AR at the indicated time points (for the full 2 hr recording see movies S1 and S2). The integrity of the microtubule cytoskeleton from untreated of PTX treated cells was visualized with mCherry-tubulin at the end of the timelapse recording and is shown in the far right panels. Arrowhead points at microtubule bundles. Lower Panel: Graphic representation of AR nuclear accumulation over time following R1881 treatment in control versus PTX-pretreated cells. Quantitative analysis of nuclear of GFP-AR was performed on each focal plane (0.5 μm Z-sections through the entire cell depth) using integrated pixel intensity values from the sum projection and the percentage of nuclear AR was calculated using the following formula: % Nuclear AR = 100*Nuclear AR/Total AR. This analysis was performed on the following number of cells for each time point and treatment condition: Control 0–20 min: n=8; 30–110 min: n=7; 120 min: n=6. PTX pretreated 0–80 min: n=12; 90 min: n=8; 100–120 min n=3. Statistical analysis was performed using T-test with equal variances (** p<0.01; *** p<0.001).
Figure 2
Figure 2. AR transcriptional activity is inhibited by taxane treatment
(A) LNCaP cells were transfected with ARE-luciferase reporter plasmid and treated overnight with the indicated concentrations of paclitaxel (PTX) in the presence or absence of R1881 (1 nM for 1 hr). AR transcriptional activity was measured using firefly luciferase values normalized to renilla luciferase to account for differences in transfection efficiency. (B) Endogenous PSA protein expression was assessed by immunoblotting of whole cell extracts from LNCaP cells treated overnight with the indicated concentrations of docetaxel (D) in the presence or absence of 1 hr treatment with 10 nM R1881 (R). Actin is shown as loading control. (C) Secreted PSA levels were measured (ng/mL) in conditioned media collected from LNCaP cells treated as is (F) with 25 or 50 nM of docetaxel (DTX). For all panels statistical values are * p<0.1; ** p<0.01; *** p<0.001)
Figure 3
Figure 3. Taxane-induced AR cytoplasmic sequestration requires microtubule stabilization
Paclitaxel treatment has no effect on AR subcellular localization in β-tubulin mutant paclitaxel-resistant cells. Parental, 1A9, and paclitaxel-resistant 1A9/PTX10 ovarian cancer cells were stably transfected with GFP-AR, treated for 2hr with either DMSO or 100nM PTX followed by the addition of 100nM DHT for another 2hr. Cells were then fixed, stained for AR, tubulin and DAPI and imaged by point scanning confocal microscopy. Solid arrows: nuclear AR; dashed arrow: microtubule bundles
Figure 4
Figure 4. AR colocalizes and cofractionates with the microtubule cytoskeleton
AR colocalizes with microtubules. PC3-AR cells were treated and processed as in Fig. 1a. Arrowhead: microtubule bundles, Solid Arrows: AR cytoplasmic sequestration at perinuclear region. Note the co-localization with microtubule bundles. Lower panel is a high magnification of the boxed cytoplasmic area depicting AR co-localization with the microtubule network. (B) AR co-immunoprecipitates with tubulin. Whole cell extracts (WCE) from LNCaP cells were immunoprecipitated with anti-tubulin antibody (Tub, lane 3) and IgG control (IgG, lane 4) and immunoblotted for AR and tubulin. 50 μg of WCE (lane 1) and 2 μg of the tubulin antibody (Tub, lane 5) alone were loaded as controls. Lane 2 is empty. (C) AR binds preferentially to the microtubule polymer. 50 μg of pre-cleared cell extract (HSS) from LNCaP cells were incubated for 30min with exogenous purified bovine brain tubulin that was either paclitaxel-stabilized at 37°C (WP and WS fractions) or colchicine depolymerized on ice (CP and CS fractions). The samples were centrifuged at 100,000 g to separate the microtubule polymers (WP and CP) from the soluble tubulin dimers (WS and CS), resolved by SDS-PAGE and immunoblotted for the presence of AR and tubulin. The distribution of AR and tubulin in each respective fraction was calculated based on the intensity of each band assessed by densitometry. For example, the percent tubulin (%Tub) is calculated as the amount of polymerized tubulin (P) over the total amount of polymerized and soluble tubulin (P + S) times 100 (%P = [P/(P + S)] × 100) based on densitometric analysis. Similar analysis was performed for AR. Note that 97% of endogenous AR co-fractionated with the majority of tubulin found in the WP microtubule fraction, while upon partial tubulin depolymerization the AR-microtubule co-fractionation decreased accordingly. HSS: high speed supernatant, WP: warm pellet, WS: warm supernatant, CP: cold pellet, CS: cold supernatant, BT: bovine brain tubulin.
Figure 5
Figure 5. AR trafficking to the nucleus is mediated by the microtubule-motor protein dynein
(A) AR co-immunoprecipitates with the microtubule motor protein dynein. Total cell extract from wild type LNCaP cells (control or treated with 10nM R1881 for 1hr) was immunoprecipitated with a dynein antibody or control IgG and immunoblotted for the presence of AR, dynein, PSA and actin shown as negative controls. (B) Overexpression of dynamitin impairs ligand-stimulated AR nuclear accumulation. PC3-AR cells were transiently transfected with pCMVH50myc (encoding a c-myc tagged human dynamitin) and subjected to R1881 treatment for 1hr. Cells were fixed, processed for double immunofluorescence labeling with antiAR (green) and c-myc (red) antibodies and analyzed by confocal microscopy. Solid arrows point to cells overexpressing dynamitin. Dashed arrows point to neighboring non-transfected cells. Scale bar: 10 μm.
Figure 6
Figure 6. Clinical response to taxane-based chemotherapy correlates with AR cytoplasmic sequestration in CTCs
(A and B) PBMCs obtained from the blood of a metastatic CRPC patient following Ficoll separation were fixed and stained for DNA (DAPI), AR and tubulin. CTCs were defined as large (>10 μm diameter), nucleated, round to oval cells, expressing AR. (A) High magnification of a CTC showing that the cytoplasmic portion of AR colocalizes with MTs (dashed arrows). (B) Microtubule integrity and subcellular localization of AR in CTCs isolated from CRPC patients receiving chemotherapy. Upper Panel: CTCs identified from a metastatic docetaxel-resistant CRPC patient treated with paclitaxel (and carboplatin). CTCs analyzed 7 days following 2nd cycle of chemotherapy. Patient did not respond with rising PSA and increased sclerotic bone metastases on bone scan. Dashed arrows point to intense AR nuclear accumulation, indicative of active AR signaling. Lower panel: CTCs identified from previously untreated metastatic CRPC patient receiving docetaxel chemotherapy. CTCs analyzed 7 days post treatment following 10th cycle of chemotherapy. Patient responding to chemotherapy by PSA working group 2 criteria. The far right panel shows a merged image of all three fluorophores. Arrows point to bundled MTs and AR sequestration in the cytoplasm, suggesting inhibition of AR signaling. (C and D) CTCs were enriched from the blood of CRPC patient using EpCAM-coated ferrobeads, fixed and stained for DNA (DAPI), PSMA, AR and tubulin (not shown). (C) EpCAM-captured CTCs express the prostate specific membrane antigen (PSMA). Arrow in the DIC panel points at the ferrobeads used to specifically capture CTCs. The right panel depicts the merged image of PSMA and DAPI. (D) The AR localization in CTCs isolated from CRPC patient 11 is shifted from the nucleus at baseline to the cytoplasm (arrow), two weeks after receiving the first dose of chemotherapy. Note the complete lack of overlap between the AR and DAPI staining clearly indicating AR nuclear exclusion. (E) PSA trends over time for 2 representative CRPC patients receiving taxane based therapy. Blood was drawn and serum PSA was measured at the indicated time points. CTCs were isolated and stained for AR, tubulin and DAPI as in (D) to determine AR subcellular localization. Ovals and diamonds on the graph represent the AR nuclear localization (cytoplasmic and nuclear, respectively) determined in CTCs isolated at these precise time points. For patient 11, evaluation of CTCs at baseline demonstrated the presence of AR in the nucleus. Following treatment, CTC analysis revealed a shift of AR to the cytoplasm, consistent with the decrease in PSA. CTCs from patient 4 demonstrated cytoplasmic AR during PSA response to taxane. However, CTCs subsequently showed AR nuclear localization before PSA progression was apparent.

References

    1. Feldman BJ, Feldman D. The development of androgen-independent prostate cancer. Nat Rev Cancer. 2001;1(1):34–45. - PubMed
    1. Petrylak DP. New paradigms for advanced prostate cancer. Rev Urol. 2007;9(Suppl 2):S3–S12. - PMC - PubMed
    1. Gelmann EP. Molecular biology of the androgen receptor. J Clin Oncol. 2002;20(13):3001–15. - PubMed
    1. Chen CD, et al. Molecular determinants of resistance to antiandrogen therapy. Nat Med. 2004;10(1):33–9. - PubMed
    1. Attard G, Richards J, de Bono JS. Targeting the androgen receptor signaling pathway in metastatic prostate cancer. Clin Cancer Res. 2011 - PMC - PubMed

Publication types

MeSH terms

LinkOut - more resources