. 2011 Jul;7(7):e1002132.
doi: 10.1371/journal.ppat.1002132. Epub 2011 Jul 14.

Dynamic evolution of pathogenicity revealed by sequencing and comparative genomics of 19 Pseudomonas syringae isolates

Affiliations

Dynamic evolution of pathogenicity revealed by sequencing and comparative genomics of 19 Pseudomonas syringae isolates

David A Baltrus et al. PLoS Pathog. 2011 Jul.

Abstract

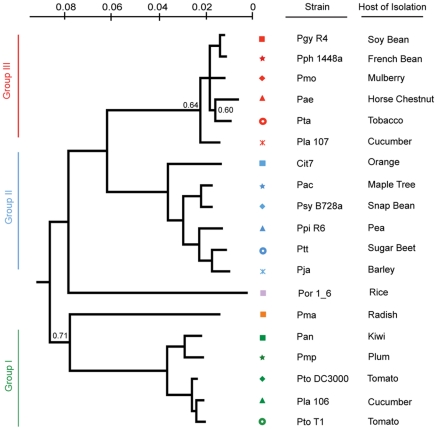
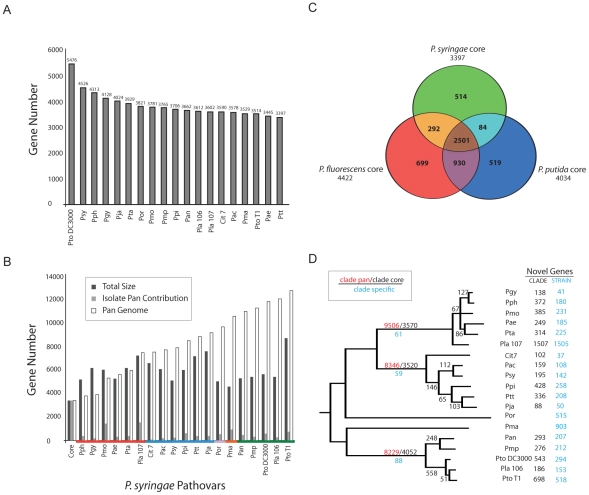
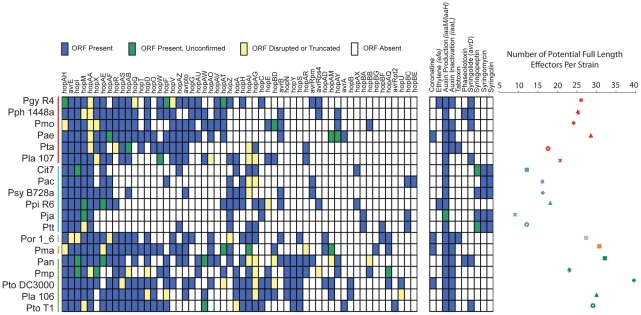
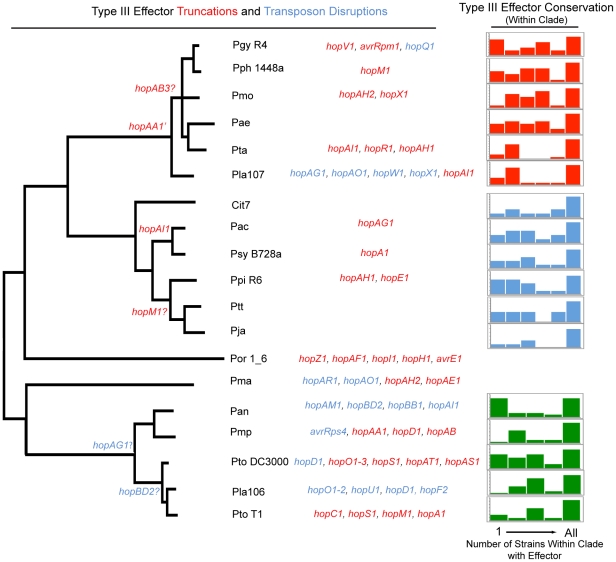
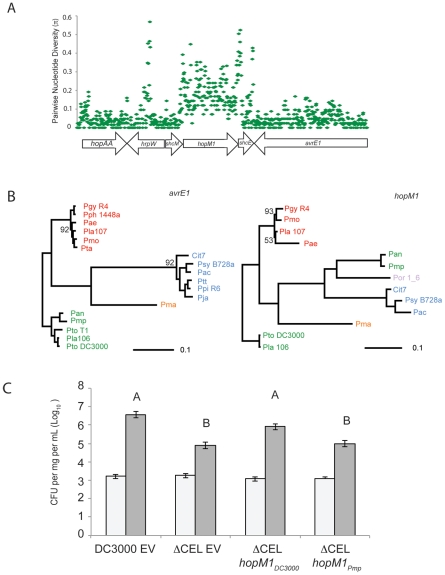
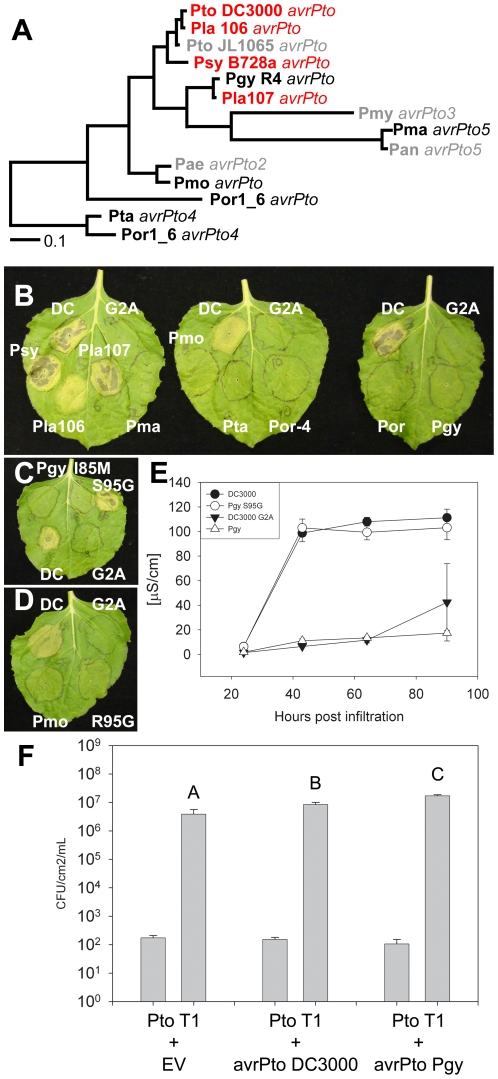
Closely related pathogens may differ dramatically in host range, but the molecular, genetic, and evolutionary basis for these differences remains unclear. In many Gram- negative bacteria, including the phytopathogen Pseudomonas syringae, type III effectors (TTEs) are essential for pathogenicity, instrumental in structuring host range, and exhibit wide diversity between strains. To capture the dynamic nature of virulence gene repertoires across P. syringae, we screened 11 diverse strains for novel TTE families and coupled this nearly saturating screen with the sequencing and assembly of 14 phylogenetically diverse isolates from a broad collection of diseased host plants. TTE repertoires vary dramatically in size and content across all P. syringae clades; surprisingly few TTEs are conserved and present in all strains. Those that are likely provide basal requirements for pathogenicity. We demonstrate that functional divergence within one conserved locus, hopM1, leads to dramatic differences in pathogenicity, and we demonstrate that phylogenetics-informed mutagenesis can be used to identify functionally critical residues of TTEs. The dynamism of the TTE repertoire is mirrored by diversity in pathways affecting the synthesis of secreted phytotoxins, highlighting the likely role of both types of virulence factors in determination of host range. We used these 14 draft genome sequences, plus five additional genome sequences previously reported, to identify the core genome for P. syringae and we compared this core to that of two closely related non-pathogenic pseudomonad species. These data revealed the recent acquisition of a 1 Mb megaplasmid by a sub-clade of cucumber pathogens. This megaplasmid encodes a type IV secretion system and a diverse set of unknown proteins, which dramatically increases both the genomic content of these strains and the pan-genome of the species.


Conflict of interest statement

The authors have declared that no competing interests exist.

Figures

Figure 1
Figure 1. A Bayesian phylogeny of P. syringae strains with draft or complete genome sequences.
Phylogenetic analysis of the 19 strains included in this study based on nucleotide sequence of seven conserved loci. Bayesian posterior probabilities are displayed on the phylogeny only at nodes where these values are <0.95. For these unresolved notes, we used an independent phylogenetic approach on another 324 genes that confirmed that this tree captures the evolutionary history of these nodes (methods; Figure S2). Each phylogenetic group as defined in was assigned its own color to the left of the phylogeny and strains were assigned symbols; this color and marker scheme continues throughout the figures. In all cases but one (Cit7; leaf surface of healthy Orange tree [95]) strains were isolated from diseased host plants listed at right.
Figure 2
Figure 2. The core- and pan-genome of P. syringae.
Collectively, P. syringae isolates share ∼50% of their ORFs with other pseudomonads. (A) The P. syringae core genome contains 3397 genes. (B) The P. syringae pan genome contains 12749 ORFs. (C) P. syringae, P. fluorescens, and P. putida share 2501 ORFs. P. syringae has the smallest core genome (3397) compared to P. fluorescens and P. putida (4422, 4034 respectively). P. fluorescens and P. putida share more genes with each other than either does with P. syringae. (D) Phylogenetic distribution of shared and clade/strain specific genes. Numbers on the earliest branch for each group indicate the size of the core (black) and pan (red) genomes for groups with multiple sequenced genomes (I, II, III), as well as the number of clade specific ORFs (blue, conserved within each group but absent from other groups). Internal branches display the number of ORFs gained, and shared by all genomes, after each branch bifurcation (see Methods). Numbers of ORFs within each genome absent from other strains within the relevant P. syringae group (black) and throughout the species (blue) are shown at the far right. Group I strains (including Pto DC3000) contain the largest number of shared ORFs and the smallest number of pan ORFs. Pja and Pla 107 have the smallest and the largest number of unique ORFs (88, 1507 respectively).
Figure 3
Figure 3. P. syringae isolates harbor extensive diversity in virulence gene repertoires.
TTE, toxin, and plant hormone biosynthesis genes are listed across the top, P. syringae genomes, color-coded by phylogenetic group as in Figure 1. At the left, a blue box indicates presence of full-length ORFs or complete pathways within each genome. Green boxes indicate that genes or pathways are present by similarity searches, but the presence of full-length genes could not be verified by PCR, or the pathways are potentially incomplete. Yellow boxes indicate that genes are either significantly truncated or are disrupted by insertion sequence elements. White boxes indicate absence of genes or pathways from the strains based on homology searches. At the far right, the total number of potentially functional TTE proteins is shown for each genome and displayed according to the color-coded strain and group symbols shown in Figure 1.
Figure 4
Figure 4. Phylogenetic conservation of disrupted and functional TTE proteins.
Parsimony was used to determine at which phylogenetic nodes TTE disruptions occurred according to the phylogeny in Figure 1. The gene names of TTEs that are truncated are displayed in red, while those that are disrupted by insertion sequence elements are in blue. TTE disruption events that could not be phylogenetically placed, and presumably occurred only in one strain, are listed to the left of the phylogeny. Question marks next to the TTE name indicate that there is conflicting information concerning disruption or disruptions that could not be verified. We include a disruption of hopF2 from Pla 106 because, even though the TTE sequence is complete, there is a transposon disruption in the shcF chaperone. At the far right, TTE conservation was determined for each genome within P. syringae groups where multiple strains were sequenced (groups I, II, III). The graph displays the percentage of each strain's TTE repertoire shared with other sequenced strains within an MLST group. The X-axis of this graph displays the number of potential strains within each MLST group that share particular TTEs with the genome of interest (max of 5 for group I and 6 for groups II and III). The percentage of singleton TTEs (found only within the strain of interest) is at the far left side of the graph, while the percentage of a strain's TTE repertoire conserved throughout the group is at the far right. The Y-axis represents the percentage of the TTE repertoire for each strain shared with other strains within the same MLST group and is scaled differently on each graph, however, the total area represented by each graph is 100% of the total effector repertoire for each strain.
Figure 5
Figure 5. A minority of shared TTE alleles display elevated levels of nucleotide divergence.
Pairwise nucleotide diversity values (π) were calculated between TTE genes shared across multiple strains within each P. syringae groups, color coded by phylogenetic group as in Figure 1, and compared to (π) values for housekeeping gene fragments from these same strains. The solid line indicates a 1∶1 ratio of π values between housekeeping genes and shared TTE. Only effector families with high π values from within phylogenetic groups are labeled.
Figure 6
Figure 6. Recombination of hopM1 in group I strains leads to functional divergence.
(A) A genomic region including hopM1 was aligned for all group I P. syringae strains with draft genome sequences and pairwise nucleotide diversity values (π) were calculated in 25 bp sliding windows. (B) Phylogenies were constructed using Bayesian methods for both avrE1 and hopM1 for all publicly available alleles. Posterior probabilities are shown if support for nodes is <0.99. Color-coding of strain names represents phylogenetic group designation as described in Figure 1. (C) schM/hopM1 from Pmp is unable to complement the virulence defect of Pto DC3000 ΔCEL in dip assays on Arabidopsis. Bars indicate mean growth at zero and four days after inoculation. Error bars are 2× standard error. Different letters indicate statistically significant differences (ANOVA, Tukey's HSD).
Figure 7
Figure 7. Phylogenetic analysis of the AvrPto superfamily reveals a residue required for avirulence function.
(A) Bayesian phylogeny for the AvrPto superfamily. Orthologs in red are recognized by Pto, orthologs in black are unrecognized, while orthologs in gray are untested. (B) Agrobacterium/N. benthamiana transient assay. Indicated AvrPto orthologs were co-expressed with Pto and symptoms are assessed at 4 days post innoculation. The Pto DC3000 AvrPto G2A mutant is a mislocalized negative control. (C) Mutation of S95G restores activity to the unrecognized ortholog AvrPtoPgy R4. Mutation of M85I does not result in recognition of AvrPtoPgy R4. (D) Mutation of R95G does not restore recognition of the AvrPtoPmo ortholog. (E) Ion leakage assay of Agrobacterium/N. Benthamiana transient inoculations. Error bars are one standard deviation. (F) Expression of either AvrPtoPto DC3000 or AvrPtoPgy R4 is sufficient to increase the virulence of Pto T1 on tomato plants incapable of recognizing AvrPto (tomato cultivar 76R prf3). Bars indicate growth at zero and four days after dip inoculation with 105 CFU/mL bacteria. Error bars are 2× standard error.

References

    1. Fatmi MB, Collmer A, Sante Iacobellis N, editors. Springer; 2008. Pseudomonas syringae Pathovars and Related Pathogens - Identification, Epidemiology, and Genomics.433
    1. Lin N-C, Martin GB. An avrPto/avrPtoB mutant of Pseudomonas syringae pv. tomato DC3000 does not elicit Pto-mediated resistance and is less virulent on tomato. MPMI. 2005;18:43–51. - PubMed
    1. Sarkar SF, Gordon JS, Martin GB, Guttman DS. Comparative genomics of host-specific virulence in Pseudomonas syringae. Genetics. 2006;174:1041–1056. - PMC - PubMed
    1. Lindeberg M, Cunnac S, Collmer A. The evolution of Pseudomonas syringae host specificity and type III effector repertoires. Mol Plant Pathol. 2009;10:767–775. - PMC - PubMed
    1. Mohr TJ, Liu H, Yan S, Morris CE, Castillo JA, et al. Naturally occurring nonpathogenic isolates of the plant pathogen Pseudomonas syringae lack a type III secretion system and effector gene orthologues. J Bacteriol. 2008;190:2858–2870. - PMC - PubMed

Publication types

Substances