. 2011 Jul 1:7:581-586.
doi: 10.1038/nphys1944.

Phase transitions in contagion processes mediated by recurrent mobility patterns

Affiliations

Phase transitions in contagion processes mediated by recurrent mobility patterns

Duygu Balcan et al. Nat Phys. .

Abstract

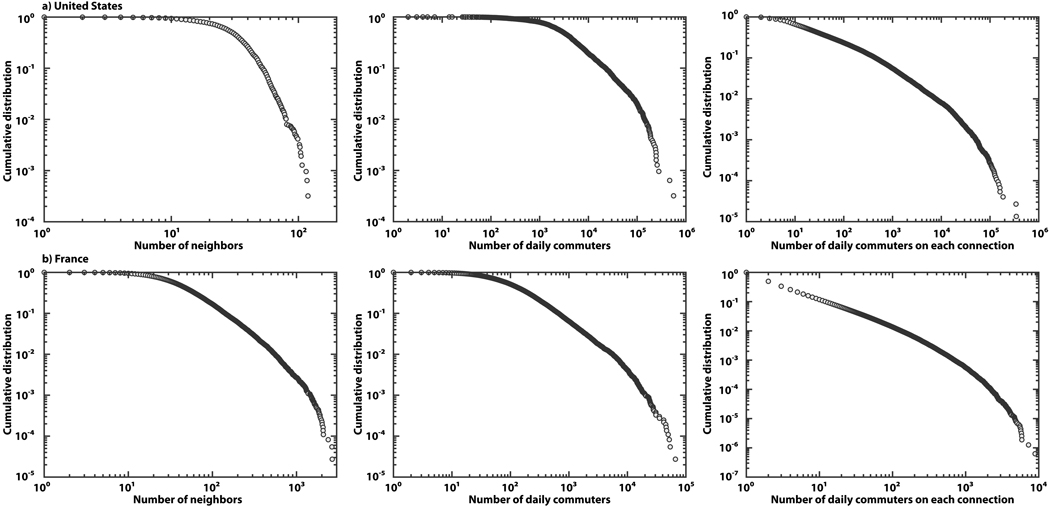
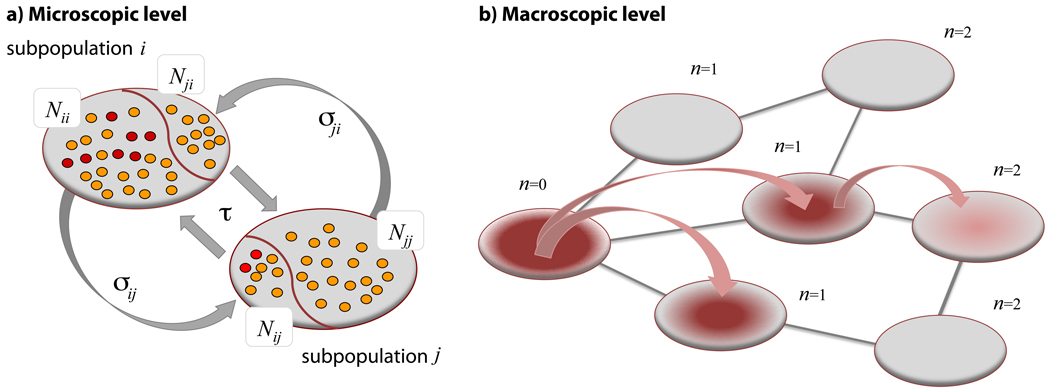
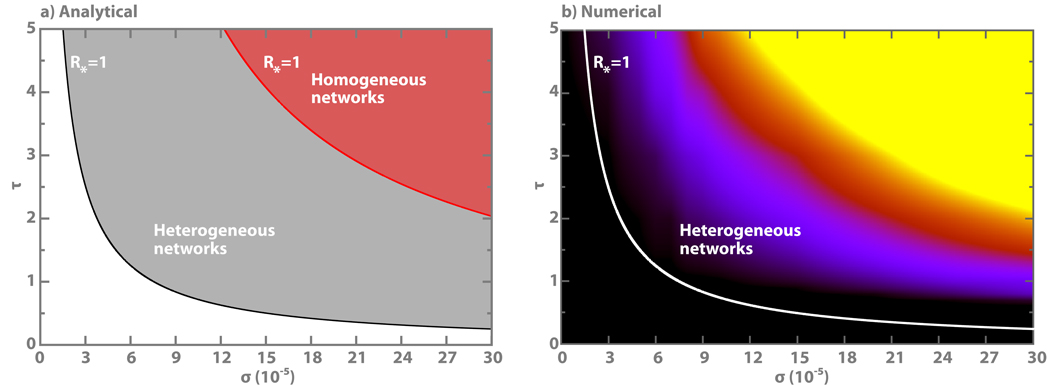
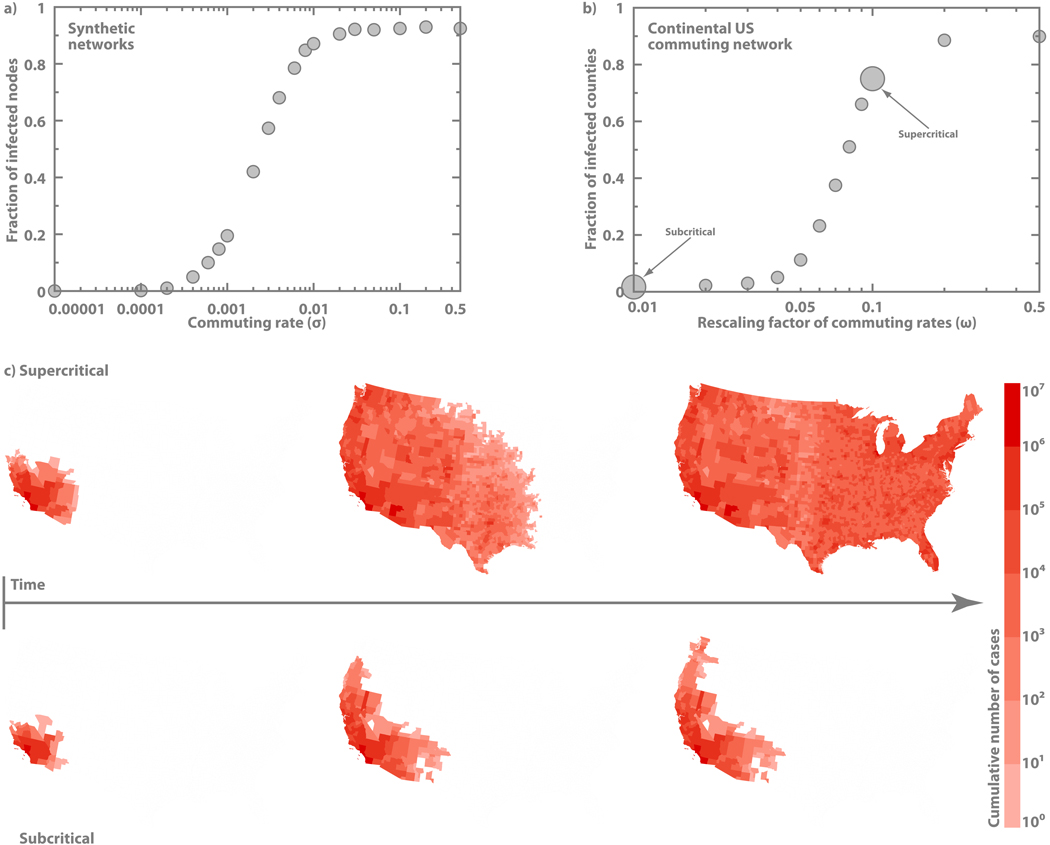
Human mobility and activity patterns mediate contagion on many levels, including: spatial spread of infectious diseases, diffusion of rumors, and emergence of consensus. These patterns however are often dominated by specific locations and recurrent flows and poorly modeled by the random diffusive dynamics generally used to study them. Here we develop a theoretical framework to analyze contagion within a network of locations where individuals recall their geographic origins. We find a phase transition between a regime in which the contagion affects a large fraction of the system and one in which only a small fraction is affected. This transition cannot be uncovered by continuous models due to the stochastic features of the contagion process and defines an invasion threshold that depends on mobility parameters, providing guidance for controlling contagion spread by constraining mobility processes. We recover the threshold behavior by analyzing diffusion processes mediated by real human commuting data.


Figures

Figure 1
Figure 1. Statistical properties of commuting networks in the United States and France
a, Commuting network in the United States at the level of counties (http://www.census.gov/). b, Commuting network in France at the level of municipalities (http://www.insee.fr/). Cumulative distributions of the number of connections (left) and the number of daily commuters (center) per administrative unit, as well as the number of daily commuters on each connection (right) are displayed. The networks are highly heterogeneous in the number of connections as well as in the commuting fluxes.
Figure 2
Figure 2. Illustration of the subpopulation invasion dynamics
a, Mixing of two subpopulations and contagion dynamics due to commuting at the microscopic level. At any time subpopulation i is occupied by a fraction of its own population Nii and a fraction of individuals Nji whose origin is in neighboring subpopulation j. The figure depicts the flux of individuals back and forth between the two subpopulations due to commuting process. This exchange of individuals is the origin of the transmission of the contagion process from subpopulation i to subpopulation j. The contagion process is mediated by contacts between infectious (red particles) and susceptible (yellow particles) individuals. b, Macroscopic representation of invasion dynamics. Nodes are organized from left to right according to their generation index n. Arrows indicates the transmission of the contagion process from a diseased subpopulation at the n − 1th generation to a subpopulation at the nth generation.
Figure 3
Figure 3. Phase diagrams separating the global invasion regime from the extinction regime
a, Plot of the equation (4) in the σ-τ space. The red and black lines identify the R* = 1 relation for the homogeneous and heterogeneous uncorrelated random networks, respectively. The global spreading regime is in the region of parameters indicated by shaded areas. The networks are made of V = 104 subpopulations, each of which accommodates a degree dependent population of Nk = N̄k/〈k〉 individuals, with = 104. Both networks have the same average degree in which the heterogeneous network has degree distribution P(k) ~ k−2.1 and the homogeneous network has Poisonian degree distribution. The SIR dynamics is characterized by R0 = 1.25 and μ−1 = 15 days. b, Numerical simulations on heterogeneous networks. The system assumes the same parameter values of (a). Color scale from black to yellow is linearly proportional to the number of infected subpopulations. Black indicates an invasion of less than 0.1% of subpopulations and yellow indicates an invasion of more than 10% of subpopulations.
Figure 4
Figure 4. Dynamical behavior of an SIR epidemic on the real US commuting network data
a, Average fraction of infected subpopulation as a function of commuting rates in networks with the same statistical properties as the heterogeneous network in Fig. 3a. Visit time in this case is fixed at τ = 1 day. b, Average fraction of infected subpopulations as a function of the intensity of commuting fluxes in the US. We study the system behavior by varying all commuting rates σij between county pairs by a factor ω as σij → ωσij. Visit time assumes a realistic value of τ = 8 hours. The infection is initially seeded in Los Angeles. The data considers only real commuting flows up to 125 miles and the actual county populations (see text). c, Temporal progression of average cumulative number of infected cases in the subcritical and supercritical regimes of the invasion dynamics. The rescaling factors used in these simulations are marked in (b). The SIR dynamics assumes R0 = 1.25 and μ−1 = 3.6 days in both cases.

References

    1. Marro J, Dickman R. Nonequilibrium Phase Transitions in Lattice Models. Cambridge: Cambridge Univ. Press; 1999.
    1. van Kampen NG. Stochastic Processes in Physics and Chemistry. North-Holland, Amsterdam: 1981.
    1. May RM, Anderson RM. Spatial heterogeneity and the design of immunization programs. Math. Biosci. 1984;72:83–111.
    1. Bolker BM, Grenfell T. Chaos and biological complexity in measles dynamics. Proc. R. Soc. London B. 1993;251:75–81. - PubMed
    1. Bolker BM, Grenfell T. Space persistence and dynamics of measles epidemics. Philos. Trans. R. Soc. London B. 1995;348:309–320. - PubMed