. 2011;6(7):e21111.
doi: 10.1371/journal.pone.0021111. Epub 2011 Jul 20.

p16( INK4a) positively regulates cyclin D1 and E2F1 through negative control of AUF1

Affiliations

p16( INK4a) positively regulates cyclin D1 and E2F1 through negative control of AUF1

Huda H Al-Khalaf et al. PLoS One. 2011.

Abstract

Background: The cyclin-D/CDK4,6/p16(INK4a)/pRB/E2F pathway, a key regulator of the critical G1 to S phase transition of the cell cycle, is universally disrupted in human cancer. However, the precise function of the different members of this pathway and their functional interplay are still not well defined.

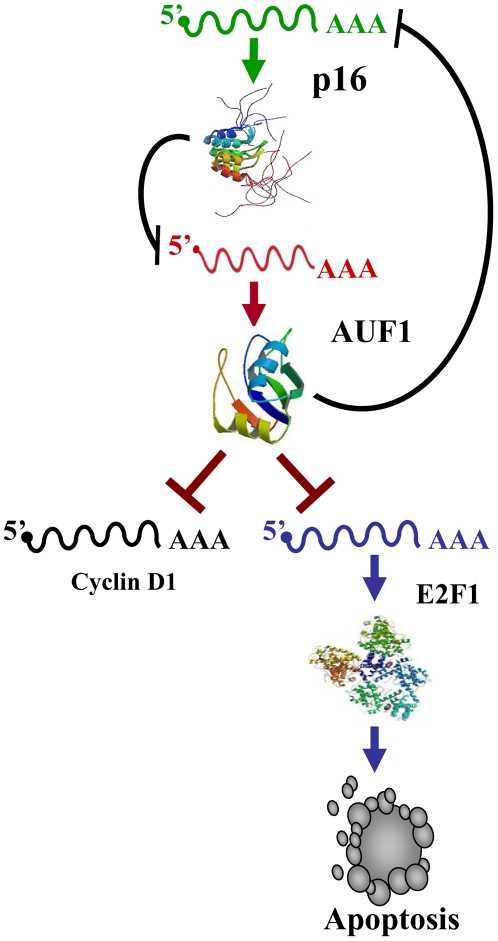
Methodology/principal findings: We have shown here that the tumor suppressor p16(INK4a) protein positively controls the expression of cyclin D1 and E2F1 in both human and mouse cells. p16(INK4a) stabilizes the mRNAs of the corresponding genes through negative regulation of the mRNA decay-promoting AUF1 protein. Immunoprecipitation of AUF1-associated RNAs followed by RT-PCR indicated that endogenous AUF1 binds to the cyclin D1 and E2F1 mRNAs. Furthermore, AUF1 down-regulation increased the expression levels of these genes, while concurrent silencing of AUF1 and p16(INK4a), using specific siRNAs, restored normal expression of both cyclinD1 and E2F1. Besides, we have shown the presence of functional AU-rich elements in the E2F1 3'UTR, which contributed to p16/AUF1-mediated regulation of E2F1 post-transcriptional events in vivo. Importantly, genome-wide gene expression microarray analysis revealed the presence of a large number of genes differentially expressed in a p16(INK4a) -dependent manner, and several of these genes are also members of the AUF1 and E2F1 regulons. We also present evidence that E2F1 mediates p16-dependent regulation of several pro- and anti-apoptotic proteins, and the consequent induction of spontaneous as well as doxorubicin-induced apoptosis.

Conclusion/significance: These findings show that the cyclin-dependent kinase inhibitor p16( INK4a) is also a modulator of transcription and apoptosis through controlling the expression of two major transcription regulators, AUF1 and E2F1.


Conflict of interest statement

Competing Interests: The authors have declared that no competing interests exist.

Figures

Figure 1
Figure 1. p16 modulates E2F1 and cyclin D1 protein and mRNA levels in human and mouse cells.
Whole cell extracts and total RNA were prepared from different human and mouse cell lines. (A–C) Western blots using the indicated antibodies. The histogram shows the expression levels of the indicated proteins. EH2 cells were treated with IPTG at 1 mM (D) Upper panel, ethidium bromide stained agarose gels showing RT-PCR products of the indicated genes. The numbers below the bands indicate the corresponding expression levels relative to β-actin. These experiments were repeated several times and representative ones are shown. The histogram shows data of real time RT-PCR of the indicated genes. Error bars indicate standard errors of 3 different experiments.
Figure 2
Figure 2. Effect of p16 on the turn-over of the cyclin D1 and E2F1 mRNAs.
HFSN1 cells were treated with actinomycin D for different periods of time as indicated. Total RNA was extracted and the mRNA levels of cyclin D1 and E2F1 were assessed by real-time RT-PCR using specific primers. Continuous lines: HFSN1 expressing control-siRNA, dotted lines: HFSN1 expressing p16-siRNA. Error bars indicate standard errors of 3 different experiments.
Figure 3
Figure 3. p16 negatively controls the AUF1 expression.
(A) Nuclear (N) and cytoplasmic (C) extracts were prepared from the indicated cells and then used for immunoblotting analysis, using the indicated antibodies (B) Total RNA was purified from the indicated cells, and RT-PCR using specific primers for the indicated genes was performed, and the generated fragments were separated on ethidium bromide stained agarose gels. The numbers below the bands indicate the corresponding expression levels relative to GAPDH. These experiments were repeated several times and representative ones are shown. EH2 cells were treated with 1 mM IPTG (C) HFSN1 cells were treated with actinomycin D and then re-incubated for the indicated periods of time. Total RNA was extracted and the amount of mRNA for the indicated genes was assessed using real time RT-PCR. The graph shows the proportion of AUF1 mRNA remaining post-treatment, and the dotted lines indicate the AUF1 mRNA half-life. Error bars indicate standard errors of 3 different experiments.
Figure 4
Figure 4. p16 controls the mRNA levels of cyclin D1 and E2F1 through AUF1.
(A) HFSN1 cells were transfected with plasmids expressing either AUF1-siRNA (pSILENCER-AUF15) or control-siRNA (pSILENCER). 3 days after transfection total RNA was purified from both cells, and RT-PCR (top panel) as well as real time RT-PCR (histogram) using specific primers for the indicated genes were performed. Error bars indicate standard errors of 3 different experiments (B) RNAs bound to the AUF1 protein were isolated by immunoprecipitation from HFSN1 cells expressing either p16-siRNA or control-siRNA using anti-AUF1 antibody or anti-IgG (as control), and then target transcripts were amplified by RT-PCR visualized on Ethidium bromide stained 1% agarose gels. Amplification of the highly abundant GAPDH transcript, which bound IP materials at background levels, was used as loading control. (C) HFSN1 whole cell lysate was immunoprecipitated using the indicated antibodies and then used for immunostaining analysis. (D) Total RNA was purified from p16 proficient (HFSN1 and EH1) and p16-deficient (U2OS and HFSN1 expressing p16-siRNA) cells, expressing either AUF1-siRNA or control-siRNA. Transcripts for the indicated genes were detected by RT-PCR, and the corresponding products were visualized on ethidium bromide stained 1% agarose gels. The numbers below the bands indicate the corresponding expression levels. GAPDH was used as internal control. These experiments were repeated several times and representative ones are shown.
Figure 5
Figure 5. Involvement of ARE in the E2F1 3′UTR and response to AUF1 and p16.
(A) Schematic diagram of the E2F1 3′UTR, ARE region sequences, and locations. (B) The E2F1 3′UTR sequences in different species (C) Sequences from the E2F1 3′UTR (ARE regions 1 to 3), IL-8 3′UTR (ARE control), and a control that lacks ARE were inserted in BamHI/XbaI sites in EGFP expression vector as shown. The Huh7 cell line (2.104 cells per well) in 96-well black clear-bottom microplates were transfected with the different 3′UTR constructs. The reporter activity was assessed after 24 hr using BD bio-imaging apparatus and software. The non-ARE 3′UTR was used as control and its fluorescence activity was taken as 100%. Data are presented as Mean±SEM (n = 4) of % of the control. *** denote p values of <0.005 (student t- test) when compared to non-ARE control. (D) Huh7 cells (left panel) or U2OS (right panel) in 96-well microplates were co-transfected with siRNA against AUF1 or scrambled control (50 ng per well) and reporter constructs (25 ng per well) as indicated. Reporter activity was assessed at 48 hr post-transfection. Data (Mean±SEM, n = 4) were presented as % increase in reporter fluorescence due to AUF1 silencing when compared to the fluorescence in control-siRNA-treated cells. * and *** denote p <0.05 and <0.005, respectively (student t-test) when compared to non-ARE control. (E) U2OS and EH1 cells (2.104 cells per well) were seeded in 96-well black clear-bottom microplates and then transfected with the different 3′UTR constructs. Reporter activity was assessed as described in (D). ANOVA was performed to compare between U2OS and EH1 data groups.
Figure 6
Figure 6. Flavopiridol does not affect the level of the AUF1 protein.
HFSN1 cells were treated with 0.3 and 0.5 µM flavopiridol for 24 hrs. Whole cell extracts were prepared and used for western blot analysis using the indicated antibodies.
Figure 7
Figure 7. Validation of mRNA levels.
The mRNA levels of 11 genes coregulated by both p16 and AUF1 were analyzed by quantitative RT-PCR in HFSN1 cells expressing either p16-siRNA or control-siRNA, and are expressed as fold difference. The error bars represent standard deviation of three different values. *: The fold difference in the expression of these genes was less than 2 in the array data.
Figure 8
Figure 8. p16 modulates apoptosis through E2F1.
(A) Western blots showing the expression of the indicated pro-and anti-apoptotic proteins in U2OS and EHI. (B) Western blots showing the expression of the indicated proteins in U2OS, U2OS cells stably transfected with plasmids encoding either scrambled sequence (ctl) or E2F1 (+). The numbers below the bands indicate the corresponding expression levels. (C) U2OS, EH1 and E2F1-expressing U2OS cells were either mock-treated or challenged with doxorubicin (2 µM) and then re-incubated for 72 hrs. Cells were then divided into two groups; one was used to analyze cell death by annexinV/PI flow cytometry. The numbers in the charts indicate the proportions of early and late apoptosis. (D) Histogram showing the proportions of apoptosis (early+late) induced by different doses of doxorubicin. The error bars represent standard deviation of three different experiments. (E) The second group of cells was used to assess the level of the indicated proteins by immunoblotting. (F) Graph showing the Bax/Bcl-2 ratio in the indicated cells after treatment with doxorubicin. Error bars represent standard deviation of at least three different experiments.
Figure 9
Figure 9. Schematic representation of the p16-related regulation of AUF1,
E2F1 and CyclinD1. See text for details.

Similar articles

Cited by

References

    1. Vogelstein B, Kinzler KW. Cancer genes and the pathways they control. Nat Med. 2004;10:789–799. - PubMed
    1. Nevins JR. The Rb/E2F pathway and cancer. Hum Mol Genet. 2001;10:699–703. - PubMed
    1. Kaye FJ. RB and cyclin dependent kinase pathways: defining a distinction between RB and p16 loss in lung cancer. Oncogene. 2002;21:6908–6914. - PubMed
    1. Giacinti C, Giordano A. RB and cell cycle progression. Oncogene. 2006;25:5220–5227. - PubMed
    1. Crosby ME, Almasan A. Opposing roles of E2Fs in cell proliferation and death. Cancer Biol Ther. 2004;3:1208–1211. - PMC - PubMed

MeSH terms