. 2011;6(7):e21919.
doi: 10.1371/journal.pone.0021919. Epub 2011 Jul 20.

The impact of the new WHO antiretroviral treatment guidelines on HIV epidemic dynamics and cost in South Africa

Affiliations

The impact of the new WHO antiretroviral treatment guidelines on HIV epidemic dynamics and cost in South Africa

Jan A C Hontelez et al. PLoS One. 2011.

Abstract

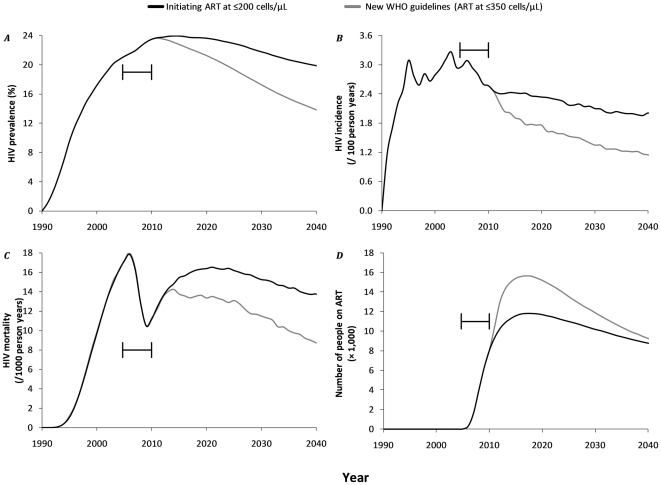
Background: Since November 2009, WHO recommends that adults infected with HIV should initiate antiretroviral therapy (ART) at CD4+ cell counts of ≤350 cells/µl rather than ≤200 cells/µl. South Africa decided to adopt this strategy for pregnant and TB co-infected patients only. We estimated the impact of fully adopting the new WHO guidelines on HIV epidemic dynamics and associated costs.

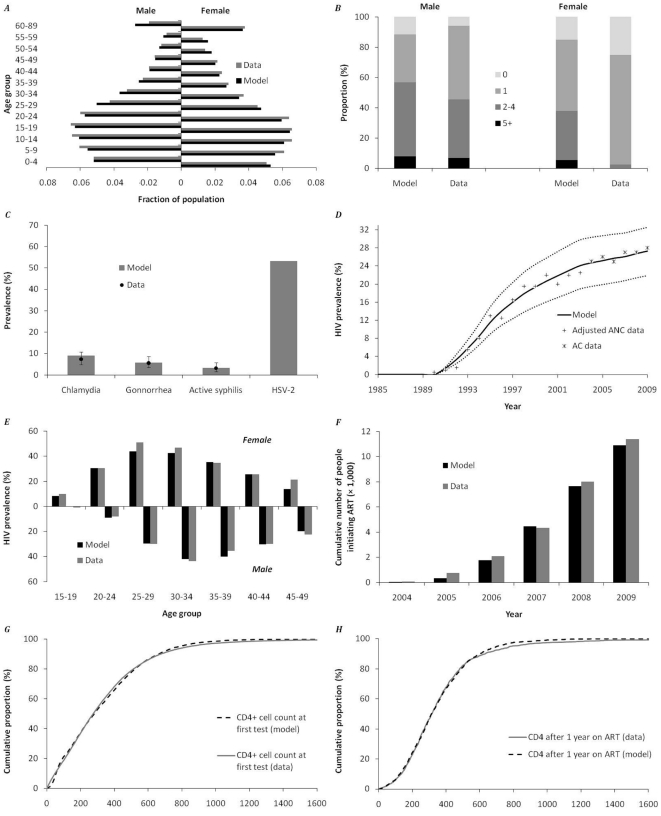
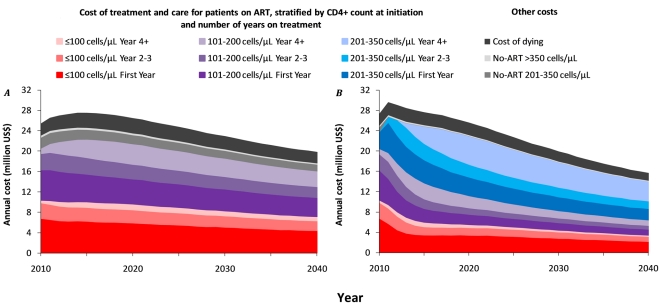
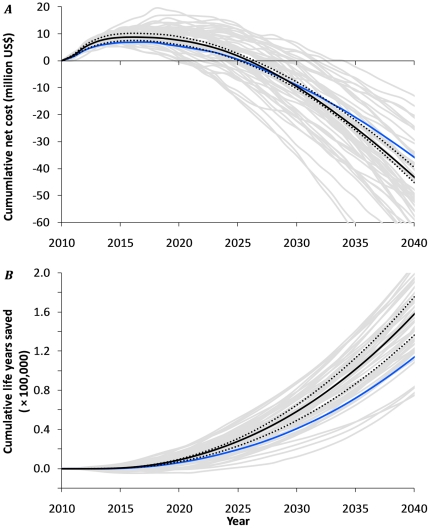
Methods and finding: We used an established model of the transmission and control of HIV in specified sexual networks and healthcare settings. We quantified the model to represent Hlabisa subdistrict, KwaZulu-Natal, South Africa. We predicted the HIV epidemic dynamics, number on ART and program costs under the new guidelines relative to treating patients at ≤200 cells/µl for the next 30 years. During the first five years, the new WHO treatment guidelines require about 7% extra annual investments, whereas 28% more patients receive treatment. Furthermore, there will be a more profound impact on HIV incidence, leading to relatively less annual costs after seven years. The resulting cumulative net costs reach a break-even point after on average 16 years.

Conclusions: Our study strengthens the WHO recommendation of starting ART at ≤350 cells/µl for all HIV-infected patients. Apart from the benefits associated with many life-years saved, a modest frontloading appears to lead to net savings within a limited time-horizon. This finding is robust to alternative assumptions and foreseeable changes in ART prices and effectiveness. Therefore, South Africa should aim at rapidly expanding its healthcare infrastructure to fully embrace the new WHO guidelines.


Conflict of interest statement

Competing Interests: The authors have declared that no competing interests exist.

Figures

Figure 1
Figure 1. Comparison of model predictions with data of the HIV-epidemic and ART rollout in Hlabisa subdistrict of the Umkhanyakunde district in KwaZulu/Natal (KZN), South Africa.
A. Modeled and actual demographic structure in 2006. Data derived from Muhwava & Nyirenda ; B. Total number of partners in the last 12 months in men and women aged 20–49 years in the model versus total number of reported partners derived from Todd et al C. Modeled and observed prevalence of classic STIs in women aged 15–49 in KZN. Data derived from White et al . D. Modeled and actual HIV epidemic in KZN. Antenatal Care (ANC) data were adjusted by applying a 1:0.6 ratio of ANC prevalence versus Africa Centre (AC) prevalence in 2004 to all data points. ANC data derived from UNAIDS , AC data from Bärnighausen et al . Prevalence in 2005–2009 is from unpublished ACDIS sero-surveillance data (age specific data, adjusted for population age-structure). Dotted lines represent the predicted HIV-prevalence when assuming a 10% increase and 10% decrease in the assumed overall partner change rate (‘promiscuity factor’). The latter roughly reflects the HIV epidemic of South Africa as a whole (prevalence of 18% in 2004) E. Modeled and actual age- and sex-specific HIV prevalence in 2004. Data derived from Bärnighausen et al ; F. Cumulative number of people initiating treatment in the Hlabisa Treatment and Care Programme, model versus unpublished data ; G. Cumulative distribution of CD4+ cell counts at first test, model compared to data for 2007 to 2009. Data derived from the Hlabisa Treatment and Care Programme . H. Cumulative distribution of CD4+ cell counts after 1 year on ART, model compared to data. Data derived from the Hlabisa Treatment and Care Programme .
Figure 2
Figure 2. Projected impact of ART at CD4+ cell counts of ≤200 /µl (black) and the new WHO treatment guidelines of ART at CD4+ cell counts of ≤350 /µl (gray) on HIV epidemic dynamics in the Hlabisa subdistrict of the Umkhanyakunde District, KwaZulu/Natal, South Africa, 1990–2040.
A. HIV prevalence; B. HIV incidence; C. HIV mortality; D. Total number of people on ART. The results reflect the average of 1000 model runs and concern adults (≥15 years). The bar indicates the timing of the initial start of ART distribution in the first clinic (end 2004) till full coverage of all 17 clinics in the area (mid 2010).
Figure 3
Figure 3. Projected cost of the ART treatment and care program in the Hlabisa subdistrict of the Umkhanyakunde District, KwaZulu/Natal, South Africa, 2010–2040.
A. Annual cost when ART is initiated at ≤200 cells/µl. B. Annual cost when ART is initiated at ≤350 cells/µ. All ART costs concern adults aged 15+ and are stratified by CD4+ cell count at initiation and number of years on ART.
Figure 4
Figure 4. Projected net cost and life-years saved of implementing the new WHO treatment guidelines (ART at CD4+ cell counts of ≤350 /µl) versus the old treatment guidelines (ART at CD4+ cell counts of ≤200 cells/µl) in the Hlabisa subdistrict of the Umkhanyakunde District, KwaZulu/Natal, South Africa, 2010–2040.
A. Cumulative net cost of treating patients at ≤350 cells/µl compared to ≤200 cells/µl. Negative values reflect net cost-savings. B. Cumulative number of life-years saved when treating patients at ≤350 cells/µl compared to ≤200 cells/µl. The black continuous line shows the average of 1000 model runs. Grey lines represent 50 individual runs to illustrate the random variation in model output. Both dotted black lines represent the results for increased and decreased levels of endemicity, when assuming a 10% higher and 10% lower overall partner change rate respectively (see also figure 1D). The blue line represents the results of treating patients at ≤350 cells/µl versus a strategy of treating patients at ≤200 cells/µl, together with 19% of patients that report with CD4+ of 201–350 cells/µl. This 19% is a crude estimation of the proportion of pregnant women and TB co-infected patients among HIV-patients with CD4+ of 201–350, who are since recently eligible to receive ART under the current South African strategy.

References

    1. WHO. Rapid Advice: Antiretroviral therapy for HIV infected adults and adolescents. Geneva: World Health Organization. 2009 Available: www.who.int/hiv/pub/arv/rapid_advice_art.pdf Accessed 2011 Jan 30.
    1. SANAC. The South African antiretroviral treatment guidelines 2010. Pretoria: South African National AIDS Council. 2010 Available: http://www.sanac.org.za/resources/art-guidelines. Accessed 2010 Dec 20.
    1. SANAC. Media statement: outline of the national HIV counseling and testing (HTC) campaign. 2010 Available: http://www.sanac.org.za/documents/Media%20Statement%2025%2003%2010.pdf. Accessed 2010 Apr 30.
    1. Palella FJ, Jr, Delaney KM, Moorman AC, Loveless MO, Furher J, et al. Declining morbidity and mortality among patients with advanced human immunodeficiency virus infection. N Eng J Med. 1998;338:853–860. - PubMed
    1. Sterne JA, May M, Costagliola D, de Wolf F, Philips AN, et al. Timing of initiation of antiretroviral therapy in AIDS-free HIV-1-infected patients: a collaborative analysis of 18 HIV cohort studies. Lancet. 2009;373:1352–1363. - PMC - PubMed

Publication types

MeSH terms

Substances