. 2011;6(7):e21957.
doi: 10.1371/journal.pone.0021957. Epub 2011 Jul 22.

Joint analysis for genome-wide association studies in family-based designs

Affiliations

Joint analysis for genome-wide association studies in family-based designs

Qiuying Sha et al. PLoS One. 2011.

Abstract

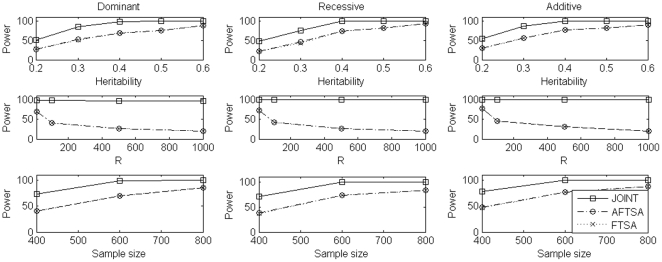
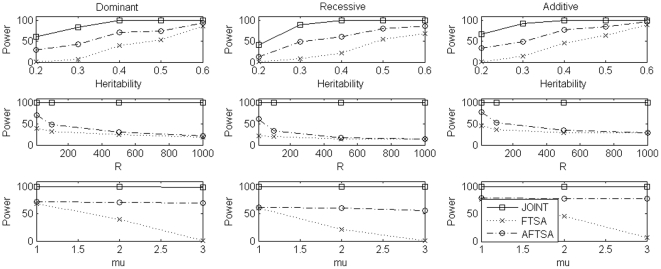
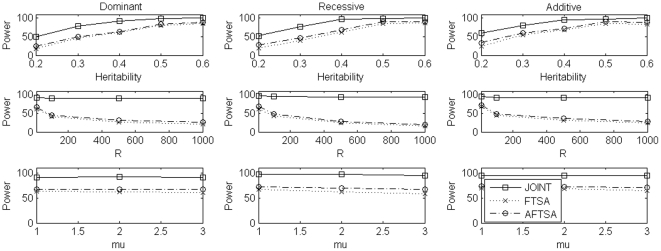
In family-based data, association information can be partitioned into the between-family information and the within-family information. Based on this observation, Steen et al. (Nature Genetics. 2005, 683-691) proposed an interesting two-stage test for genome-wide association (GWA) studies under family-based designs which performs genomic screening and replication using the same data set. In the first stage, a screening test based on the between-family information is used to select markers. In the second stage, an association test based on the within-family information is used to test association at the selected markers. However, we learn from the results of case-control studies (Skol et al. Nature Genetics. 2006, 209-213) that this two-stage approach may be not optimal. In this article, we propose a novel two-stage joint analysis for GWA studies under family-based designs. For this joint analysis, we first propose a new screening test that is based on the between-family information and is robust to population stratification. This new screening test is used in the first stage to select markers. Then, a joint test that combines the between-family information and within-family information is used in the second stage to test association at the selected markers. By extensive simulation studies, we demonstrate that the joint analysis always results in increased power to detect genetic association and is robust to population stratification.


Conflict of interest statement

Competing Interests: The authors have declared that no competing interests exist.

Figures

Figure 1
Figure 1. Power comparison under simulation set 1 when μ = 2.
In the first row, we compare power of the three methods for different values of heritability under the three disease models while sample size is 600 trios and the number of markers selected at the first stage is 10. In the second row, we compare power of the three methods for different numbers of markers selected at the first stage under the three disease models while sample size is 600 trios and heritability is 0.05. In the third row, we compare power of the three methods for different sample sizes under the three disease models while heritability is 0.05 and the number of markers selected at the first stage is 10. In each case, we use 800 genomic markers to control for population stratification in the admixture screening test.
Figure 2
Figure 2. Power comparison under simulation set 2 when sample size is 600 trios.
In the first row, we compare power of the three methods for different values of heritability under the three disease models while μ = 2 and the number of markers selected at the first stage is 10. In the second row, we compare power of the three methods for different numbers of markers selected at the first stage under the three disease models while μ = 2 and heritability is 0.05. In the third row, we compare power of the three methods for different values of μ under the three disease models while heritability is 0.05 and the number of markers selected at the first stage is 10. In each case, we use 800 genomic markers to control for population stratification in the admixture screening test.
Figure 3
Figure 3. Power comparison under simulation set 3 when sample size is 600 trios.
In the first row, we compare power of the three methods for different values of heritability under the three disease models while μ = 2 and the number of markers selected at the first stage is 10. In the second row, we compare power of the three methods for different numbers of markers selected at the first stage under the three disease models while μ = 2 and heritability is 0.05. In the third row, we compare power of the three methods for different values of μ under the three disease models while heritability is 0.05 and the number of markers selected at the first stage is 10. In each case, we use 800 genomic markers to control for population stratification in the admixture screening test.

References

    1. Spielman RS, McGinnis RE, Ewens WJ. The transmission test for linkage disequilibrium: the insulin gene and insulin-dependent diabetes mellitus (IDDM). Am J Hum Genet. 1993;52:506–516. - PMC - PubMed
    1. Bickeboller H, Clerget-Darpoux F. Statistical properties of the allelic and genotypic transmission/disequilibrium test for multi-allelic markers. Genet Epidemiol. 1995;12:865–870. - PubMed
    1. Sham PC, Curtis D. An extended transmission/disequilibrium test (TDT) for multi-allele marker loci. Ann Hum Genet. 1995;59:323–336. - PubMed
    1. Schaid DJ. General score tests for associations of genetic markers with disease using cases and their parents. Genet Epidemiol. 1996;13:423–449. - PubMed
    1. Spielman RS, Ewens WJ. A sibship test for linkage in the presence of association: the sib transmission/disequilibrium test. Am J Hum Genet. 1998;62:450–458. - PMC - PubMed

Publication types

Substances