

A SNAP-tagged derivative of HIV-1--a versatile tool to study virus-cell interactions
- PMID: 21799764
- PMCID: PMC3142126
- DOI: 10.1371/journal.pone.0022007
A SNAP-tagged derivative of HIV-1--a versatile tool to study virus-cell interactions
Abstract
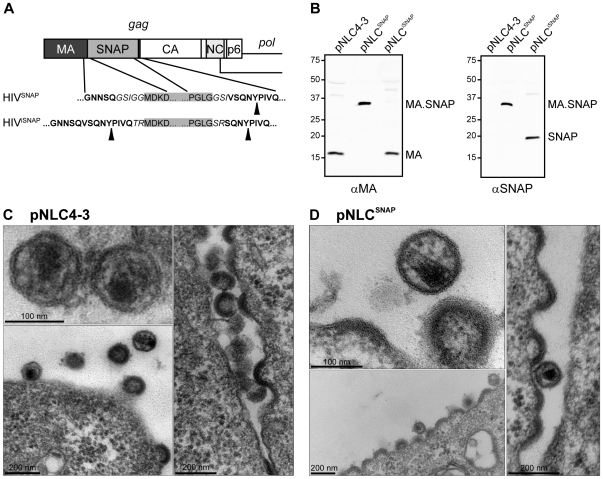
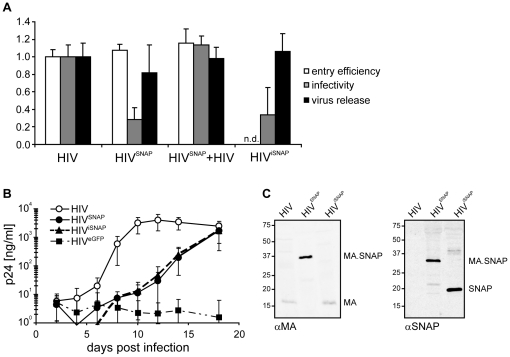
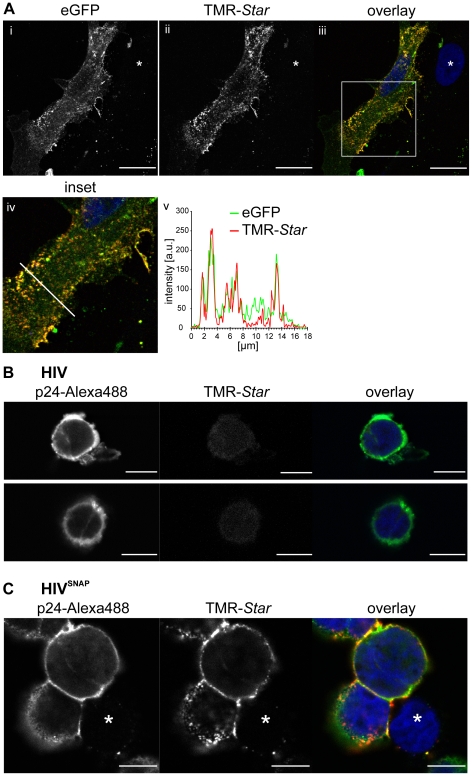
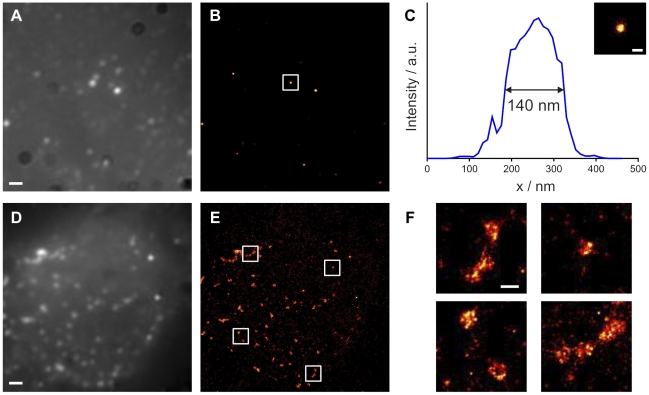
Fluorescently labeled human immunodeficiency virus (HIV) derivatives, combined with the use of advanced fluorescence microscopy techniques, allow the direct visualization of dynamic events and individual steps in the viral life cycle. HIV proteins tagged with fluorescent proteins (FPs) have been successfully used for live-cell imaging analyses of HIV-cell interactions. However, FPs display limitations with respect to their physicochemical properties, and their maturation kinetics. Furthermore, several independent FP-tagged constructs have to be cloned and characterized in order to obtain spectral variations suitable for multi-color imaging setups. In contrast, the so-called SNAP-tag represents a genetically encoded non-fluorescent tag which mediates specific covalent coupling to fluorescent substrate molecules in a self-labeling reaction. Fusion of the SNAP-tag to the protein of interest allows specific labeling of the fusion protein with a variety of synthetic dyes, thereby offering enhanced flexibility for fluorescence imaging approaches.Here we describe the construction and characterization of the HIV derivative HIV(SNAP), which carries the SNAP-tag as an additional domain within the viral structural polyprotein Gag. Introduction of the tag close to the C-terminus of the matrix domain of Gag did not interfere with particle assembly, release or proteolytic virus maturation. The modified virions were infectious and could be propagated in tissue culture, albeit with reduced replication capacity. Insertion of the SNAP domain within Gag allowed specific staining of the viral polyprotein in the context of virus producing cells using a SNAP reactive dye as well as the visualization of individual virions and viral budding sites by stochastic optical reconstruction microscopy. Thus, HIV(SNAP) represents a versatile tool which expands the possibilities for the analysis of HIV-cell interactions using live cell imaging and sub-diffraction fluorescence microscopy.
Conflict of interest statement
Figures
Similar articles
-
Construction and characterization of a fluorescently labeled infectious human immunodeficiency virus type 1 derivative.J Virol. 2004 Oct;78(19):10803-13. doi: 10.1128/JVI.78.19.10803-10813.2004. J Virol. 2004. PMID: 15367647 Free PMC article.
-
Investigating the role of F-actin in human immunodeficiency virus assembly by live-cell microscopy.J Virol. 2014 Jul;88(14):7904-14. doi: 10.1128/JVI.00431-14. Epub 2014 Apr 30. J Virol. 2014. PMID: 24789789 Free PMC article.
-
Sequence of human immunodeficiency virus type 1 (HIV-1) Gag localization and oligomerization monitored with live confocal imaging of a replication-competent, fluorescently tagged HIV-1.J Virol. 2007 Nov;81(22):12596-607. doi: 10.1128/JVI.01088-07. Epub 2007 Aug 29. J Virol. 2007. PMID: 17728233 Free PMC article.
-
How HIV-1 Gag Manipulates Its Host Cell Proteins: A Focus on Interactors of the Nucleocapsid Domain.Viruses. 2020 Aug 13;12(8):888. doi: 10.3390/v12080888. Viruses. 2020. PMID: 32823718 Free PMC article. Review.
-
Tracking and quantitation of fluorescent HIV during cell-to-cell transmission.Methods. 2011 Jan;53(1):20-6. doi: 10.1016/j.ymeth.2010.06.018. Epub 2010 Jul 11. Methods. 2011. PMID: 20627127 Free PMC article. Review.
Cited by
-
Direct and dynamic detection of HIV-1 in living cells.PLoS One. 2012;7(11):e50026. doi: 10.1371/journal.pone.0050026. Epub 2012 Nov 28. PLoS One. 2012. PMID: 23209635 Free PMC article.
-
Detection of viral RNA by fluorescence in situ hybridization (FISH).J Vis Exp. 2012 May 5;(63):e4002. doi: 10.3791/4002. J Vis Exp. 2012. PMID: 22588480 Free PMC article.
-
HIV taken by STORM: super-resolution fluorescence microscopy of a viral infection.Virol J. 2012 May 2;9:84. doi: 10.1186/1743-422X-9-84. Virol J. 2012. PMID: 22551453 Free PMC article.
-
Synchronized HIV assembly by tunable PIP2 changes reveals PIP2 requirement for stable Gag anchoring.Elife. 2017 Jun 2;6:e25287. doi: 10.7554/eLife.25287. Elife. 2017. PMID: 28574338 Free PMC article.
-
New Routes and Opportunities for Modular Construction of Particulate Vaccines: Stick, Click, and Glue.Front Immunol. 2018 Jun 26;9:1432. doi: 10.3389/fimmu.2018.01432. eCollection 2018. Front Immunol. 2018. PMID: 29997617 Free PMC article. Review.
References
-
- Lampe M, Briggs JA, Endress T, Glass B, Riegelsberger S, et al. Double-labelled HIV-1 particles for study of virus-cell interaction. Virology. 2007;360:92–104. - PubMed
Publication types
MeSH terms
Substances
LinkOut - more resources
Full Text Sources
Miscellaneous
