. 2011;6(7):e22062.
doi: 10.1371/journal.pone.0022062. Epub 2011 Jul 20.

Proteomic biomarkers for acute interstitial lung disease in gefitinib-treated Japanese lung cancer patients

Affiliations

Proteomic biomarkers for acute interstitial lung disease in gefitinib-treated Japanese lung cancer patients

Fredrik Nyberg et al. PLoS One. 2011.

Abstract

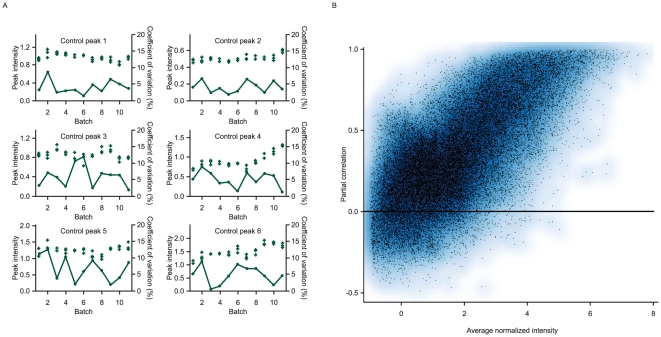
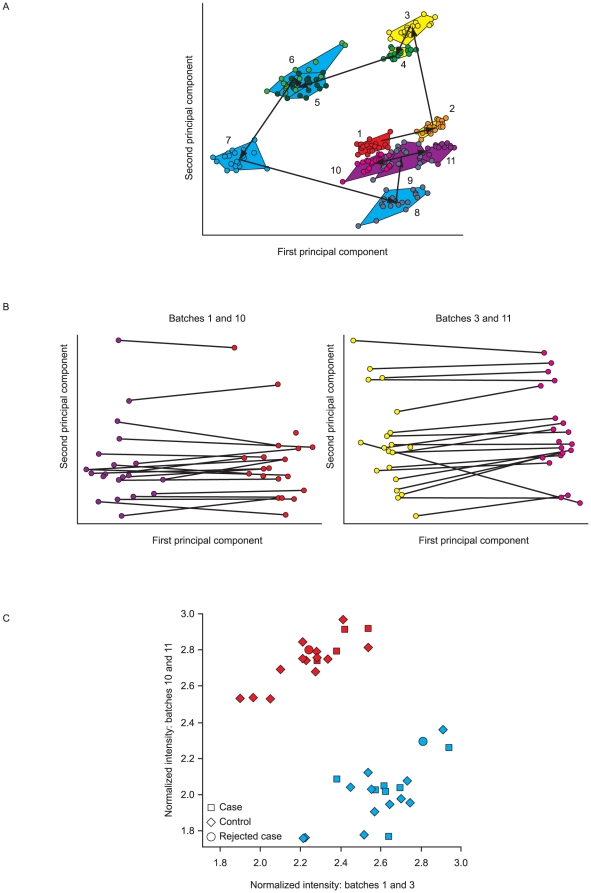
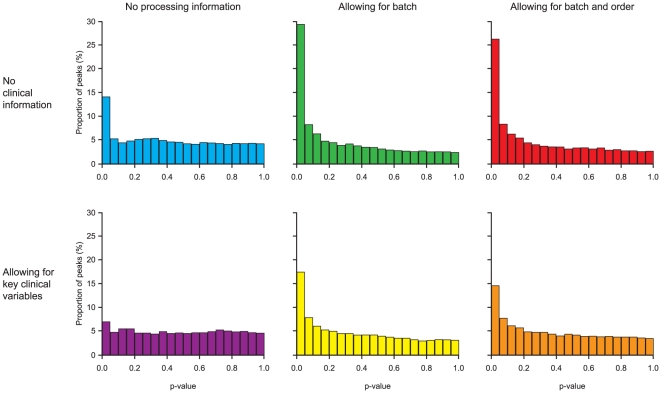
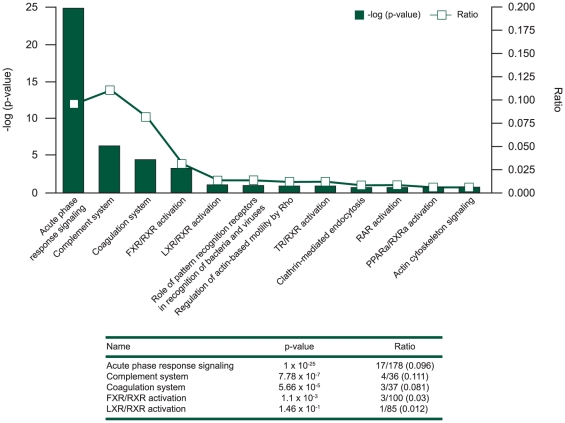
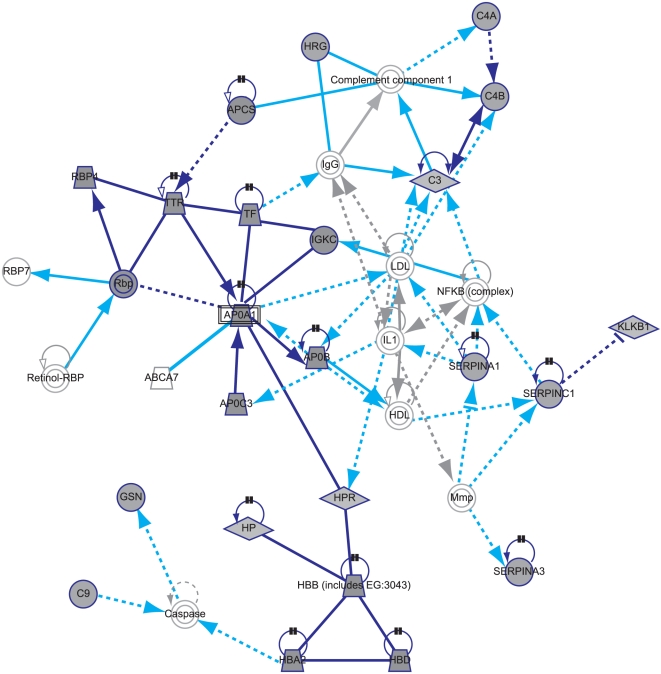
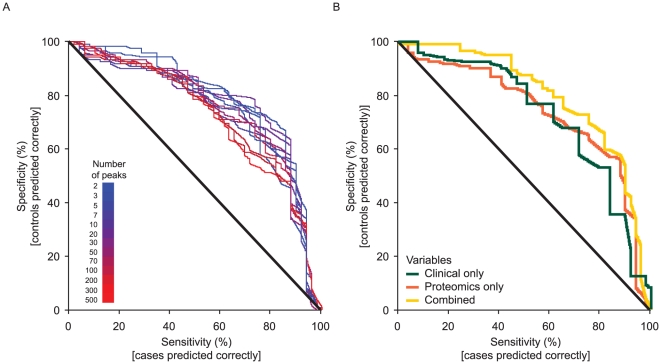
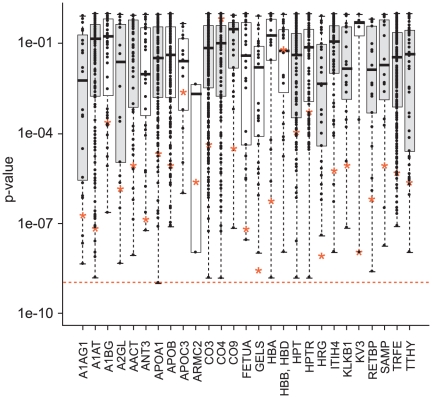
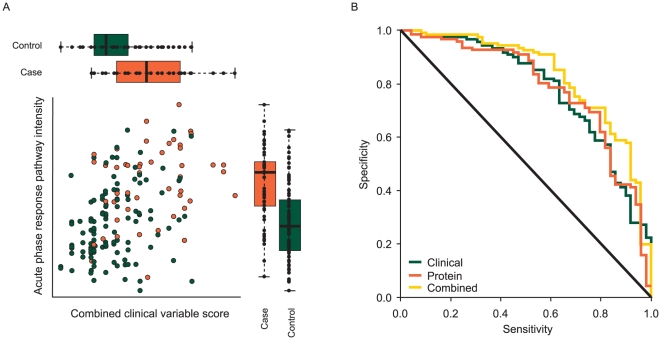
Interstitial lung disease (ILD) events have been reported in Japanese non-small-cell lung cancer (NSCLC) patients receiving EGFR tyrosine kinase inhibitors. We investigated proteomic biomarkers for mechanistic insights and improved prediction of ILD. Blood plasma was collected from 43 gefitinib-treated NSCLC patients developing acute ILD (confirmed by blinded diagnostic review) and 123 randomly selected controls in a nested case-control study within a pharmacoepidemiological cohort study in Japan. We generated ∼7 million tandem mass spectrometry (MS/MS) measurements with extensive quality control and validation, producing one of the largest proteomic lung cancer datasets to date, incorporating rigorous study design, phenotype definition, and evaluation of sample processing. After alignment, scaling, and measurement batch adjustment, we identified 41 peptide peaks representing 29 proteins best predicting ILD. Multivariate peptide, protein, and pathway modeling achieved ILD prediction comparable to previously identified clinical variables; combining the two provided some improvement. The acute phase response pathway was strongly represented (17 of 29 proteins, p = 1.0×10(-25)), suggesting a key role with potential utility as a marker for increased risk of acute ILD events. Validation by Western blotting showed correlation for identified proteins, confirming that robust results can be generated from an MS/MS platform implementing strict quality control.


Conflict of interest statement

Competing Interests: FN, CGH, ISP, MCS and IGC are employees of AstraZeneca and own shares in the company. AO, TK, K. Nagasaka, ST, KW, HKT, MO, Y. Kyono, TD, Y. Komatsu, MK, SA, and TN are/were employees of Medical Proteoscope Co., Ltd. TH is an employee of Chiesi Farmaceutici. TH and GMV are previous employees of AstraZeneca. MF has received honoraria from AstraZeneca. K. Nakata, YO, SK, and HK have declared that no conflicts of interest exist.

Figures

Figure 1
Figure 1. Quality control: reproducibility of control samples and sample duplicates.
(A) Reproducibility of 6 control peaks for the 3 standard quality control samples, plotted as ‘+’, in each analysis batch (peak intensity, left axis). The coefficients of variation (%, right axis) between the 3 control samples in each batch are plotted as points joined by a line. (B) Reproducibility of peptide intensities for 39 samples with duplicate analyses in different analysis batches. Partial correlation, after removing between batch differences, plotted against the average normalized intensity for each peptide. Higher intensity peptides show high reproducibility in their intensities between repeated batches.
Figure 2
Figure 2. Exploratory data analysis of MS signal intensities using PCA.
(A) Plot of first two principal components from PCA analysis of the full proteomic data from all 11 analysis batches (numbered 1–11 in time sequence). Each sample is represented by a single point, with the range of points within each batch being shown by a polygon joining the extreme points in that batch. (B) Plots of the first two principal components for the repeated batches of samples (1 and 10, 3 and 11). Individual samples are represented by a line, connecting the two replicates in different batches. (C) Reproducibility of an example differentially expressed peptide between two duplicate batch runs of proteomic analysis. The intensities of the first and second runs for each replicated sample are plotted against each other. Samples colored by batch (batch 1 repeated as batch 10 – blue; batch 3, repeated as batch 11 – red). Allowing for between-sequence differences there is a good correlation between replicate runs.
Figure 3
Figure 3. Distribution of significance tests of differential expression between cases and controls for individual peptides.
The figure shows the effect on the distribution of p-values for differential expression of including analysis processing information and clinical variables.
Figure 4
Figure 4. Significant associated pathways with ILD status.
The most significant pathways from an analysis linking the identified 29 proteins from the study to curated pathways in the Ingenuity Pathway Analysis system are shown, ordered according to the ratio between the number of protein markers that can be associated with the pathway and the number of proteins in the pathway.
Figure 5
Figure 5. Highest scoring Ingenuity Pathway Analysis network.
Highest scoring network generated from entering the identified 29 proteins into the Ingenuity Pathway Analysis system, with proteins identified in the study shaded grey and connecting proteins identified by Ingenuity Pathway Analysis non-shaded. Dark blue shapes and lines  =  proteins identified as predictors in this study and interactions between them. Grey shapes and lines  =  proteins identified by Ingenuity to generate the network and interactions between them. Light blue lines  =  interactions between proteins identified by Ingenuity to generate the network and the proteins identified in the study. Figure S4A shows this figure with the interaction relationships labeled. Proteins identified in the study and included in the network: SERPINA1  =  alpha-1-antitrypsin; SERPINA3  =  alpha-1-antichymotrypsin; SERPINC1  =  antithrombin-III; APOA1  =  apolipoprotein A-I; APOB  =  apolipoprotein B-100; APOC3  =  apolipoprotein C-III; C3  =  complement C3; C4A, C4B  =  complement C4-A; complement C4-B; C9  =  complement component C9; GSN  =  gelsolin; HBA2  =  hemoglobin alpha; HBB, HBD  =  hemoglobin beta/delta; HP  =  haptoglobin; HPR  =  haptoglobin-related protein; HRG  =  histidine-rich glycoprotein; KLKB1  =  plasma kallikrein; IGKC  =  Ig kappa chain V-III region Ti; RBP4, Rbp  =  retinol binding protein 4; APCS  =  serum amyloid P-component; TF  =  serotransferrin; TTR  =  transthyretin. Proteins identified in the study and not included in the network: ORM1  =  alpha-1-acid glycoprotein 1; A1BG  =  alpha-1B-glycoprotein; LRG1  =  leucine-rich alpha-2-glycoprotein; ARMC2  =  armadillo repeat-containing protein 2; AHSG  =  alpha-2-HS-glycoprotein; ITIH4  =  inter-alpha-trypsin inhibitor heavy chain H4.
Figure 6
Figure 6. Receiver operating characteristics curve of cross-validated predictions.
(A) from peptides, for different number of peptides included in the proteomic prediction model, and (B) from clinical data, proteomic data, and a combination of both clinical and proteomic data.
Figure 7
Figure 7. Significance levels from the proteins, constituent peptides, and acute phase pathway intensities.
p-values for the proteins are shown by red stars, p-values for individual peptides are shown by points, and the distribution of these for each protein is shown by a boxplot. In each boxplot, the upper and lower sides of the box represent the higher and lower quartile values (Q3 and Q1), respectively. The black bar in each box represents the median value. The p-value for the acute phase pathway is represented by the dashed line; boxplots for proteins in the acute phase response pathway are shaded. A1AG1  =  alpha-1-acid glycoprotein 1; A1AT  =  alpha-1-antitrypsin; A1BG  =  alpha-1B-glycoprotein; A2GL  =  leucine-rich alpha-2-glycoprotein; AACT  =  alpha-1-antichymotrypsin; ANT3  =  antithrombin-III; APOA1  =  apolipoprotein A-I; APOB  =  apolipoprotein B-100; APOC3  =  apolipoprotein C-III; ARMC2  =  armadillo repeat-containing protein 2; CO3  =  complement C3; CO4  =  complement C4-A; complement C4-B; CO9  =  complement component C9; FETUA  =  alpha-2-HS-glycoprotein; GELS  =  gelsolin; HBA  =  hemoglobin alpha; HBB, HBD  =  hemoglobin beta/delta; HPT  =  haptoglobin; HPTR  =  haptoglobin-related protein; HRG  =  histidine-rich glycoprotein; ITIH4  =  inter-alpha-trypsin inhibitor heavy chain H4; KLKB1  =  plasma kallikrein; KV3  =  Ig kappa chain V-III region Ti; RETBP  =  retinol binding protein 4; SAMP  =  serum amyloid P-component; TRFE  =  serotransferrin; TTHY  =  transthyretin.
Figure 8
Figure 8. Plots illustrating the relationship between acute phase response pathway intensity score and clinical variable score.
(A) Plot of the acute phase response intensity against the combined clinical variable score measuring the likelihood of a subject being a case calculated from a model predicting case-control status based only on the clinical variables WHO PS, smoking history, extent of normal lung coverage on CT scan, and severity of pre-existing ILD, with boxplots comparing the distribution of these measures in cases and controls. In each boxplot, the upper/right and lower/left sides of the box represent the higher and lower quartile values (Q3 and Q1), respectively. The black bar in each box represents the median value. (B) Receiver operating characteristics curve of cross-validated predictions from clinical data, the acute phase response intensity and a combination of the clinical data and acute phase response intensity.

Similar articles

Cited by

References

    1. American Thoracic Society, European Respiratory Society. American Thoracic Society/European Respiratory Society International Multidisciplinary Consensus Classification of the Idiopathic Interstitial Pneumonias. This joint statement of the American Thoracic Society (ATS), and the European Respiratory Society (ERS) was adopted by the ATS board of directors, June 2001 and by the ERS Executive Committee, June 2001. Am J Respir Crit Care Med. 2002;165:277–304. - PubMed
    1. Inoue A, Saijo Y, Maemondo M, Gomi K, Tokue Y, et al. Severe acute interstitial pneumonia and gefitinib. Lancet. 2003;361:137–139. - PubMed
    1. Kudoh S, Kato H, Nishiwaki Y, Fukuoka M, Nakata K, et al. Interstitial lung disease in Japanese patients with lung cancer: a cohort and nested case-control study. Am J Respir Crit Care Med. 2008;177:1348–1357. - PubMed
    1. Wells AU, Hogaboam CM. Update in diffuse parenchymal lung disease 2006. Am J Respir Crit Care Med. 2007;175:655–660. - PubMed
    1. Raghu G, Nyberg F, Morgan G. The epidemiology of interstitial lung disease and its association with lung cancer. Br J Cancer. 2004;91(Suppl 2):S3–S10. - PMC - PubMed

Publication types

MeSH terms