. 2011;6(7):e22151.
doi: 10.1371/journal.pone.0022151. Epub 2011 Jul 25.

On the treatment of airline travelers in mathematical models

Affiliations

On the treatment of airline travelers in mathematical models

Michael A Johansson et al. PLoS One. 2011.

Abstract

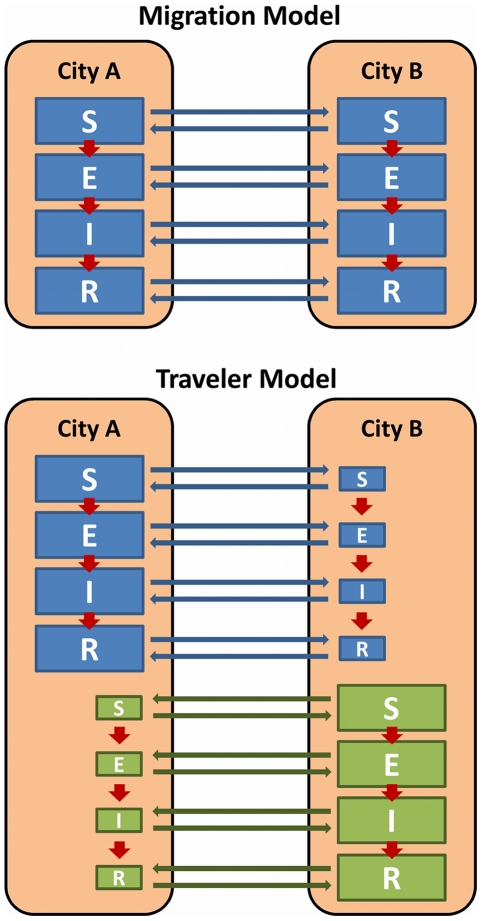
The global spread of infectious diseases is facilitated by the ability of infected humans to travel thousands of miles in short time spans, rapidly transporting pathogens to distant locations. Mathematical models of the actual and potential spread of specific pathogens can assist public health planning in the case of such an event. Models should generally be parsimonious, but must consider all potentially important components of the system to the greatest extent possible. We demonstrate and discuss important assumptions relative to the parameterization and structural treatment of airline travel in mathematical models. Among other findings, we show that the most common structural treatment of travelers leads to underestimation of the speed of spread and that connecting travel is critical to a realistic spread pattern. Models involving travelers can be improved significantly by relatively simple structural changes but also may require further attention to details of parameterization.


Conflict of interest statement

Competing Interests: The authors have declared that no competing interests exist.

Figures

Figure 1
Figure 1. Alternative travel model structures.
Two different model structures are shown using a simplified, two-city, Susceptible (S)-Exposed (E)-Infected (I)-Recovered (R) model. In the migration model, travelers represent migrants, mixing the populations of the two cities, City A and B. In the traveler model, some residents from City A (blue) and City B (green) travel temporarily to the other city, but eventually return to their original city. In each model, individuals may progress through the infection stages (red arrows), the rates of which may be city-dependent.
Figure 2
Figure 2. Timing of first autochthonous human infection: migration vs. traveler model.
Each line is the empirical cumulative probability (for 100 simulations) of the first autochthonous transmission event in a single city in a single model. The dotted lines are for a city closely connected to the origin city for the traveler (black) and migration (red) models. The solid lines are for a more distal city. A. is the directly transmitted pathogen and B. is the vector-borne pathogen.
Figure 3
Figure 3. Epidemic recurrence in the city where the epidemic originates.
A. The mean proportion of the population newly infected per day for the traveler (black) and migration (red) models. The pathogen only persists in the migration model and causes a second outbreak approximately two years after the first. B. The mean proportion of the population susceptible (black), incubating and infectious (red), and recovered (blue) in the migration model over time. Approximately 20% of the population is replaced by incoming susceptibles between the two epidemics.
Figure 4
Figure 4. Timing of first autochthonous human infection: direct- vs. connecting-travel network model with the directly transmitted pathogen.
Each line is the empirical cumulative probability (for 100 simulations) of the first autochthonous transmission for the connecting-travel model (black) and direct-travel model (red) for 3 cities: A. directly connected to the origin city; B. non-directly connected, intermediate distance city; and C. a distant city.
Figure 5
Figure 5. Timing of first autochthonous human infection: direct- vs. connecting-travel network model with the vector-borne pathogen.
Each line is the empirical cumulative probability (for 100 simulations) of the first autochthonous transmission for the connecting-travel model (black) and direct-travel model (red) for 3 cities: A. directly connected to the origin city; B. non-directly connected, intermediate distance city; and C. a distant city.

References

    1. Grais RF, Ellis JH, Glass GE. Assessing the impact of airline travel on the geographic spread of pandemic influenza. European Journal of Epidemiology. 2003;18:1065–1072. - PubMed
    1. Fraser C, Donnelly CA, Cauchemez S, Hanage WP, Van Kerkhove MD, et al. Pandemic potential of a strain of influenza A (H1N1): early findings. Science. 2009;324:1557–1561. - PMC - PubMed
    1. Hufnagel L, Brockmann D, Geisel T. Forecast and control of epidemics in a globalized world. Proceedings of the National Academy of Sciences of the United States of America. 2004;101:15124–15129. - PMC - PubMed
    1. Wilder-Smith A, Gubler DJ. Geographic expansion of dengue: the impact of international travel. Medical Clinics of North America. 2008;92:1377–1390. - PubMed
    1. Soumahoro MK, Fontenille D, Turbelin C, Pelat C, Boyd A, et al. Imported chikungunya virus infection. Emerging Infectious Diseases. 2010;16:162–163. - PMC - PubMed