Clinical Trial
. 2011;6(7):e22271.
doi: 10.1371/journal.pone.0022271. Epub 2011 Jul 22.

Impact on malaria parasite multiplication rates in infected volunteers of the protein-in-adjuvant vaccine AMA1-C1/Alhydrogel+CPG 7909

Affiliations
Clinical Trial

Impact on malaria parasite multiplication rates in infected volunteers of the protein-in-adjuvant vaccine AMA1-C1/Alhydrogel+CPG 7909

Christopher J A Duncan et al. PLoS One. 2011.

Abstract

Background: Inhibition of parasite growth is a major objective of blood-stage malaria vaccines. The in vitro assay of parasite growth inhibitory activity (GIA) is widely used as a surrogate marker for malaria vaccine efficacy in the down-selection of candidate blood-stage vaccines. Here we report the first study to examine the relationship between in vivo Plasmodium falciparum growth rates and in vitro GIA in humans experimentally infected with blood-stage malaria.

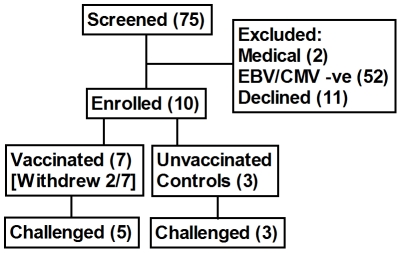
Methods: In this phase I/IIa open-label clinical trial five healthy malaria-naive volunteers were immunised with AMA1/C1-Alhydrogel+CPG 7909, and together with three unvaccinated controls were challenged by intravenous inoculation of P. falciparum infected erythrocytes.

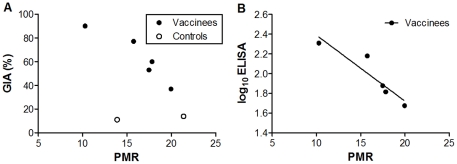
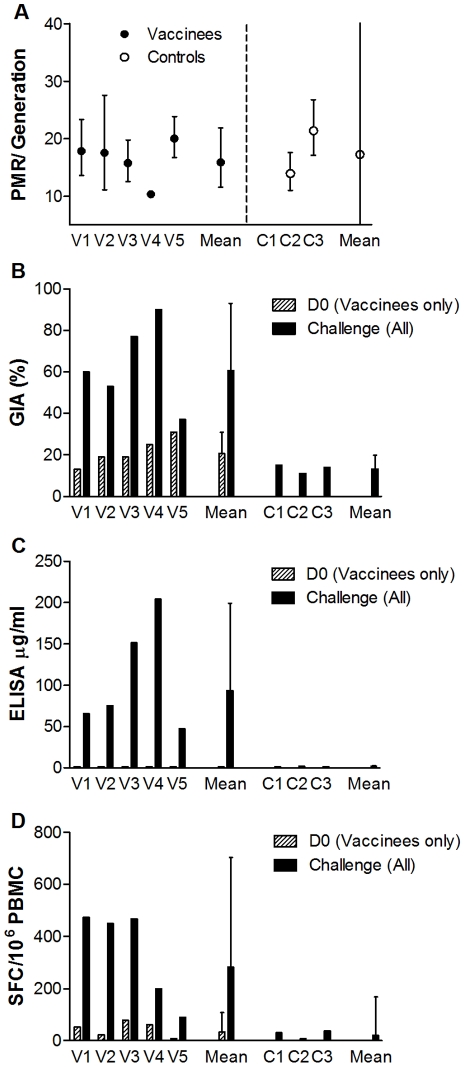
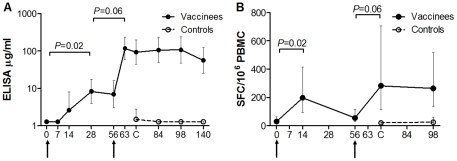
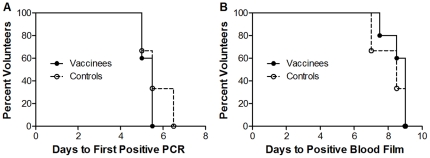
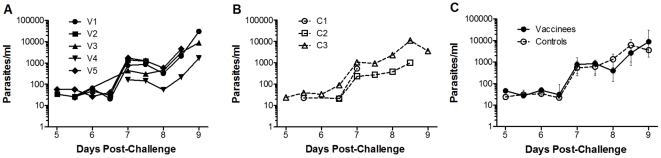
Results: A significant correlation was observed between parasite multiplication rate in 48 hours (PMR) and both vaccine-induced growth-inhibitory activity (Pearson r = -0.93 [95% CI: -1.0, -0.27] P = 0.02) and AMA1 antibody titres in the vaccine group (Pearson r = -0.93 [95% CI: -0.99, -0.25] P = 0.02). However immunisation failed to reduce overall mean PMR in the vaccine group in comparison to the controls (vaccinee 16 fold [95% CI: 12, 22], control 17 fold [CI: 0, 65] P = 0.70). Therefore no impact on pre-patent period was observed (vaccine group median 8.5 days [range 7.5-9], control group median 9 days [range 7-9]).

Conclusions: Despite the first observation in human experimental malaria infection of a significant association between vaccine-induced in vitro growth inhibitory activity and in vivo parasite multiplication rate, this did not translate into any observable clinically relevant vaccine effect in this small group of volunteers.

Trial registration: ClinicalTrials.gov [NCT00984763].


Conflict of interest statement

Competing Interests: The authors have declared that no competing interests exist.

Figures

Figure 1
Figure 1. Participant Flow.
Seventy-five volunteers were screened for participation, and ten volunteers were enrolled. The majority of prospective volunteers were excluded by EBV or CMV sero-negativity. Two immunised volunteers withdrew consent before the challenge due to moving from the study area, one was replaced prior to challenge.
Figure 2
Figure 2. Vaccine-Induced in vitro Growth Inhibitory Activity (GIA) and Antibody Titre Correlates with in vivo Parasite Multiplication Rate (PMR).
(•) Represents immunised volunteers and (○) represents control volunteers. All analyses are two-tailed Pearson correlation coefficients. Assays of GIA and ELISA (both 3D7-AMA1) were performed once in triplicate on day of challenge samples. GIA is expressed as percent inhibition calculated as follows: 100−[(O.D.650 of infected RBCs with tested IgG−O.D.650 of normal RBCs only)/(O.D.650 of infected RBCs without any IgG−O.D.650 of normal RBCs only)×100]. ELISA units are log10 µg/ml. Parasite multiplication rate per 48 hours was modelled from qPCR data. A. Correlation between vaccine-induced GIA on day of challenge and 48-hour PMR (r = −0.93 [95% CI: −1.0, −0.27] P = 0.02). When all volunteers (vaccinated and control) were examined together there was a trend towards an association (r = −0.61 [95% CI: −0.94, 0.27] P = 0.15). B. Correlation between log10 transformed 3D7-AMA1 ELISA (µg/ml) and 48-hour PMR (r = −0.93 [95% CI: −0.99, −0.25] P = 0.02).
Figure 3
Figure 3. Individual Subject Parasite Multiplication Rates and Immunological Measures at Day of Challenge.
(•) Represents immunised volunteers and (○) represents control volunteers. All panels display means and error bars represent 95% confidence intervals. Assays of GIA and ELISA were performed once in triplicate. ELIspot assays were performed once in duplicate. GIA is expressed as percent inhibition calculated as follows: 100−[(O.D.650 of infected RBCs with tested IgG−O.D.650 of normal RBCs only)/(O.D.650 of infected RBCs without any IgG−O.D.650 of normal RBCs only)×100]. ELISA units are µg/ml, ELIspot units are IFN-γ spot forming colonies (SFCs) per 106 PBMCs. Parasite multiplication rate per 48-hours was modelled from qPCR data. A. 48-hour parasite multiplication rates (PMR) for individuals and arithmetic mean 48-hour PMR for the group. PMR for volunteer C1 could not be accurately modelled as there were only three qPCR data-points . Arithmetic mean PMRs were not significantly different (vaccine 16-fold [95% CI: 12–22] (n = 5), control 17-fold [95% CI: 0–65] (n = 2) P = 0.70, t test). B. Individual and group mean percentage GIA. There were similar levels of detectable GIA in all volunteers at enrollment (d0 for immunised group, day of challenge for control group); mean vaccine group 21% [95% CI: 13–30] (n = 5), control group 13% [95% CI: 8–19] (n = 3) P = 0.10, t test. C. Geometric mean antibody ELISA (µg/ml) and D. geometric mean T cell ELIspot responses (IFN-γ SFC/106 PMBC) to 3D7-AMA1 at day 0 (immunised group) and day of challenge (all groups, the first assessment for controls was day of challenge). All immunology endpoints were significantly higher in vaccinees than controls at challenge (GIA P<0.01 t test; ELIspot P = 0.04 Mann-Whitney; ELISA P = 0.04 Mann-Whitney).
Figure 4
Figure 4. Timecourse of Homologous (3D7) Strain Antibody and T Cell Responses.
(•) Represents immunised volunteers and (○) represents control volunteers. Numbers on ‘x’ axes represent days of follow-up. Arrows represent immunisations. Geometric mean 3D7-strain AMA1 antibody responses by ELISA (µg/ml) (A) and ex vivo 3D7-strain IFN-γ ELIspot (SFC/106 PMBC) (B) for immunised volunteers (n = 7) and controls (n = 3) are presented. ELISA assays were performed once in triplicate. ELIspot assays were performed once in duplicate. Statistical comparisons are with the two-tailed Wilcoxon signed rank test. A. A significant increase in 3D7-strain AMA1 antibody responses by ELISA (µg/ml) was observed for first immunisation (n = 7). Responses were non-significantly boosted by the second immunisation in challenged volunteers (n = 5) and were maintained at day 140. No significant increase in detectable response was identified in the control volunteers post-challenge. B. A significant increase in ex vivo 3D7-strain IFN-γ ELIspot (SFC/106 PMBC) response was observed following the first immunisation in all volunteers (n = 7). Responses were non-significantly boosted by the second immunisation in challenged volunteers (n = 5). No significant increase in detectable response was observed in control volunteers post-challenge.
Figure 5
Figure 5. Intracellular Cytokine Staining.
AMA1-C1 protein-stimulated live CD3+ CD4+ T cells positive for the Th1 cytokines IFN-γ TNF-α and IL-2 assayed on cryopreserved PBMCs obtained on the day of enrollment (d0) and day of challenge (dCH) from vaccinated and challenged volunteers (n = 5). Statistical comparisons are with the two-tailed Wilcoxon signed rank test. There was a non-significant increase in median percentage of live CD3+ CD4+ cells positive for TNF-α, IFN-γ and IL-2 (TNF-α d0: 0.003% [range 0.002–0.014], dCH: 0.009% [range 0.0–0.035], P = 0.31; IFN-γ d0: 0.0% [range 0.0–0.020], dCH: 0.010% [0.0–0.069], P = 0.58; IL-2 d0: 0.036% [range 0.022–0.061], dCH: 0.051% [range 0.035–0.072], P = 0.13 Wilcoxon signed rank test).
Figure 6
Figure 6. Adverse Events.
All solicited and unsolicited adverse events post-vaccination considered possibly, probably or definitely vaccine-related up to day 140. One volunteer experienced a grade 3 headache and rigors on the evening of the first dose (day 0) which required oral analgesia and resulted in a missed day of work. The rigors resolved within several hours and the headache reduced in intensity within 24 hours, and resolved on day 2. ‘Other’ refers to transient injection-site discomfort relating to minor trauma 5 days after vaccination.
Figure 7
Figure 7. Kaplan-Meier Survival Analysis of Time to Parasitaemia.
Survival analysis of A. time to parasitaemia by thick blood film microscopy (P = 0.45 log-rank test), vaccine group (bold line) median 8.5 days (range 7.5–9), control group median 9 days (range 7–9) B. Time to first positive qPCR value (P = 0.40 log-rank test), vaccine group median 5.5 days (range 5–5.5), control group median 5.5 days (range 5–6.5).
Figure 8
Figure 8. Quantitative PCR.
Individual qPCR data (parasites/ml) for A. immunised and B. control volunteers. C. Median qPCR data (with interquartile ranges) for vaccine and control groups. No significant differences were observed between the groups at any time-point (data not shown). qPCR was performed once in triplicate at each time-point.

Similar articles

Cited by

References

    1. Roberts L, Enserink M. Malaria. Did they really say … eradication? Science. 2007;318:1544–1545. - PubMed
    1. Plowe CV, Alonso P, Hoffman SL. The potential role of vaccines in the elimination of falciparum malaria and the eventual eradication of malaria. J Infect Dis. 2009;200:1646–1649. - PubMed
    1. Goodman AL, Draper SJ. Blood-stage malaria vaccines - recent progress and future challenges. Ann Trop Med Parasitol. 104:189–211. - PubMed
    1. Ellis RD, Sagara I, Doumbo O, Wu Y. Blood stage vaccines for Plasmodium falciparum: Current status and the way forward. Hum Vaccin. 2010;6 - PMC - PubMed
    1. Crompton PD, Miura K, Traore B, Kayentao K, Ongoiba A, et al. In vitro growth-inhibitory activity and malaria risk in a cohort study in mali. Infect Immun. 2010;78:737–745. - PMC - PubMed

Publication types

MeSH terms

Associated data