. 2011;6(7):e22305.
doi: 10.1371/journal.pone.0022305. Epub 2011 Jul 25.

Using mitochondrial and nuclear sequence data for disentangling population structure in complex pest species: a case study with Dermanyssus gallinae

Affiliations

Using mitochondrial and nuclear sequence data for disentangling population structure in complex pest species: a case study with Dermanyssus gallinae

Lise Roy et al. PLoS One. 2011.

Abstract

Among global changes induced by human activities, association of breakdown of geographical barriers and impoverishered biodiversity of agroecosystems may have a strong evolutionary impact on pest species. As a consequence of trade networks' expansion, secondary contacts between incipient species, if hybrid incompatibility is not yet reached, may result in hybrid swarms, even more when empty niches are available as usual in crop fields and farms. By providing important sources of genetic novelty for organisms to adapt in changing environments, hybridization may be strongly involved in the emergence of invasive populations. Because national and international trade networks offered multiple hybridization opportunities during the previous and current centuries, population structure of many pest species is expected to be the most intricate and its inference often blurred when using fast-evolving markers. Here we show that mito-nuclear sequence datasets may be the most helpful in disentangling successive layers of admixture in the composition of pest populations. As a model we used D. gallinae s. l., a mesostigmatid mite complex of two species primarily parasitizing birds, namely D. gallinae L1 and D. gallinae s. str. The latter is a pest species, considered invading layer farms in Brazil. The structure of the pest as represented by isolates from both wild and domestic birds, from European (with a focus on France), Australian and Brazilian farms, revealed past hybridization events and very recent contact between deeply divergent lineages. The role of wild birds in the dissemination of mites appears to be null in European and Australian farms, but not in Brazilian ones. In French farms, some recent secondary contact is obviously consecutive to trade flows. Scenarios of populations' history were established, showing five different combinations of more or less dramatic bottlenecks and founder events, nearly interspecific hybridizations and recent population mixing within D. gallinae s. str.


Conflict of interest statement

Competing Interests: The authors have declared that no competing interests exist.

Figures

Figure 1
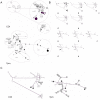
Figure 1. Haplotype MJN networks with post-processing parsimony analysis.
A. Bird type information (black areas, wild birds; grey areas, chicken; squared areas, layer). Top, COI. Bottom, Tpm exon n, intron n, exon n+1. The size of the circles is proportional to the haplotype frequency, except that an upper size limit has been set to 20 for COI topologie and 40 for Tpm topology (keep in mind that Tpm gene is diploid). Numbers inside or close to circles appear in cases where the limit is exceeded and represent the observed number of occurrence. The length of links between haplotypes is proportional to the number of mutated positions. The median vectors that represent hypothetical intermediates or unsampled haplotypes are shown in small open circles. The most important haplotype (most frequent) are labelled (label followed by *) following the designation used in . In COI (top), dotted lines delineate lineages Lmt1, Lmt2 and Lmt3 as defined in . Lmt3+ represents lineage Lmt3 plus basal haplotypes not included in any lineages in . In Tpm (bottom), dotted lines delineate lineages Ln1, Ln2, Ln3, Ln4 and the clade Tro_16+Tro_17 as defined in . B. Geographical origin of farm individuals in which haplotypes have been isolated (a, France, b, Denmark, c, Poland, d, Brazil, e, Australia). Top, COI. Bottom, Tpm. Haplotypes found in each country are represented by solid circles, whereas open circles represent haplotypes which have not been found in the considered country. C. Haplotype networks highlighting haplotypes encountered in the two wild isolates (gray circles): black center, ROL, white center, IL.
Figure 2
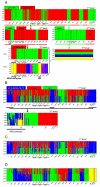
Figure 2. Summary of hierarchical results.
A. COI. Ln assignment value threshold >0.8. Only two of the 469 individuals under test kept unassigned (<0.6, max inferred ancestry 0.54>x>0.58) (both from CON and located basally to Lmt3 in haplotype networks) B. Tpm. Black: Ln assignment value threshold >0.6 (91% individual inferred ancestry >0.9). Grey : intercluster heterozygous (mean 0.450/0.550 [0.405–0.595]).
Figure 3
Figure 3. Structure Q plots.
Hierarchical Structure analyses performed to determine the number of genetic groups (K) present in D. gallinae s. l. isolates under test using whole sequence datasets. See Table S1 for details on each isolate. A. COI whole sequence dataset. The Q plot shown for each analysis was generated using the value of K associated with ΔKm. Each individual included in a given analysis is represented by a vertical bar showing degree of admixture. Arrows indicate subsequent hierarchical analyses. Remark on third level (left): 2 different bar plots with respectively K = 2 and K = 5 are displayed, because ΔK values calculated following Evanno et al. (2005) generated 2 sharp peaks at these two values, instead of a single one. B. Tpm whole sequence datasets, nucleotidic substitutions. C. Tpm, 8 indels, first-level analysis only. D. Combined COI and Tpm whole datasets.
Figure 4
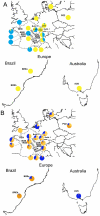
Figure 4. Comparison of patterns of mitochondrial and nuclear genetic variation in D. gallinae s. str.
Clusters retained from first-level Structure results with whole sequence datasets as well as with datasets excluding pairs of sites with a significant (P>0.005) rLD value >0.5 (see Figure S2). The maps depict the Europe (top), an eastern portion of Brazil (bottom, left) and the eastern part of Australia which includes Victoria (bottom, right). Farms CON, 8028, 8029, 9003, 9004 and 9005 are located in the French region named “Bresse”. Coloured circles represent isolates and are labeled following Table S1. Farm CON is the focused farm within which several different buildings/points/years have been sampled and correspond to isolates 8021 and 9016 (build. 1, sampling years 2008 and 2009 resp.) and 9007 (build. 5, sampling year 2009). Isolate from farm Bau has been genotyped on COI only. Labels are coloured according to the type of sampled bird: black bold, isolates from layer farms, black italic, isolates from “Poulets de Bresse” AOC broilers, grey bold, isolates from the wild avifauna. A. COI. Isolate circles are coloured based on the proportion of individuals assigned to either of the two mtDNA first-level clusters: Lmt1 (light blue), Lmt2–3 (yellow). Individuals assigned to Lmt1 have in most cases the mitochondrial haplotype Co_1 and in some cases have one haplotype differing from Co_1 by one or two mutated positions. B. Tpm. Isolate circles are coloured based on the proportion of individuals assigned to either of the three nDNA first-level clusters: Ln1 (dark orange), Ln2 (light orange), Ln3–4 (blue).

References

    1. Mack RN, Simberloff D, Lonsdale WM, Evans H, Clout M, et al. Biotic invasions: causes, epidemiology, global consequences, and control. Ecol appl. 2000;10:689–710.
    1. Huber DM, Hugh-Jones ME, Rust MK, Sheffield SR, Simberloff D, et al. Invasive pest species: impacts on agricultural production, natural resources, and the environment. 2002. Council for Agricultural Science and Technology (CAST) no. 20 ( http://library.wur.nl/journals/local/cast.htm)
    1. Kneitel JM, Perrault D. Disturbance-induced changes in community composition increase species invasion success. Community ecol. 2006;7:245–252.
    1. Lee CE. Evolutionary genetics of invasive species. Trends ecol evol. 2002;17:386–391.
    1. Seehausen O, Takimoto G, Roy D, Jokela J. Speciation reversal and biodiversity dynamics with hybridization in changing environments. Mol ecol. 2008;17:30–44. - PubMed

Publication types

Substances