. 2011;6(7):e22514.
doi: 10.1371/journal.pone.0022514. Epub 2011 Jul 22.

Activation of autophagy in a rat model of retinal ischemia following high intraocular pressure

Affiliations

Activation of autophagy in a rat model of retinal ischemia following high intraocular pressure

Antonio Piras et al. PLoS One. 2011.

Abstract

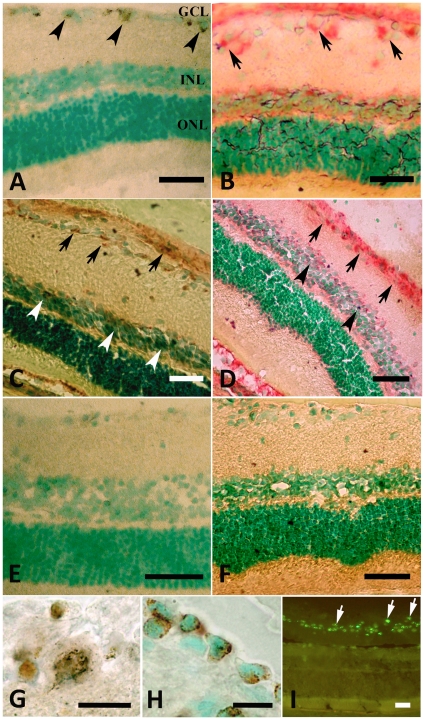
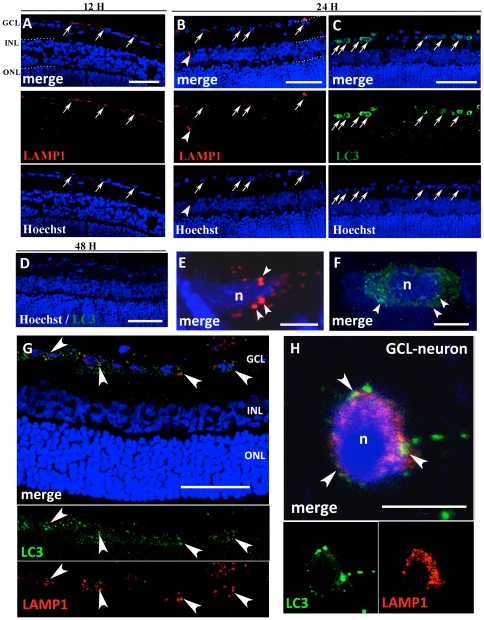
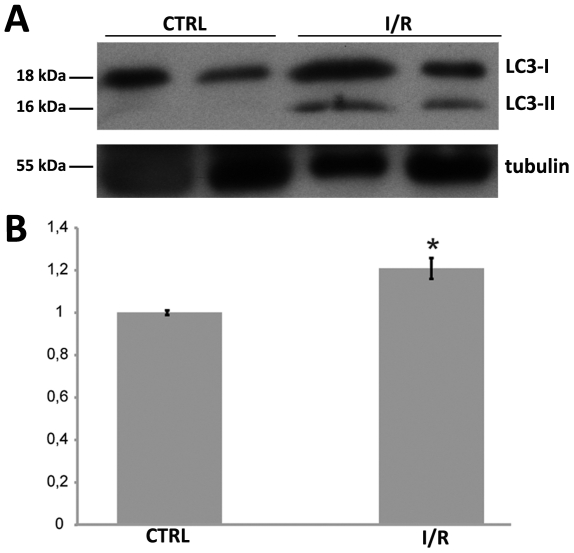
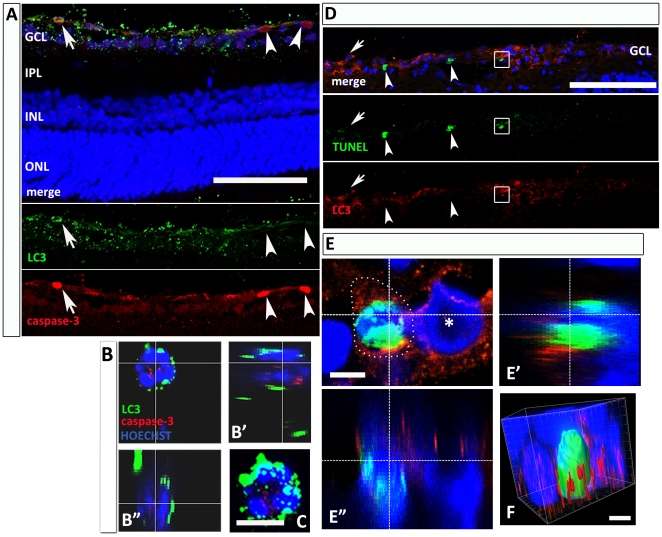
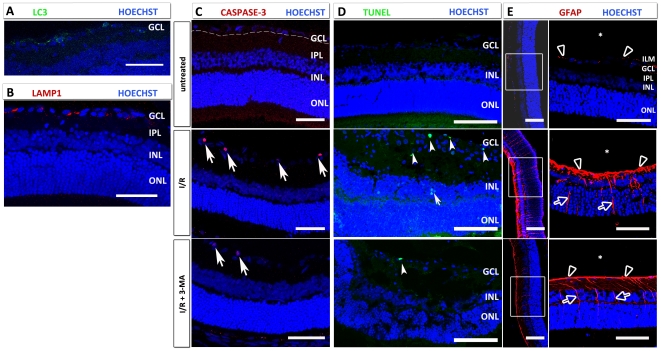
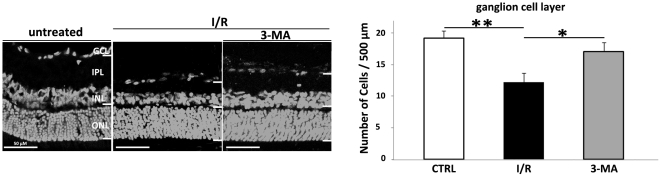
Acute primary open angle glaucoma is an optic neuropathy characterized by the elevation of intraocular pressure, which causes retinal ischemia and neuronal death. Rat ischemia/reperfusion enhances endocytosis of both horseradish peroxidase (HRP) or fluorescent dextran into ganglion cell layer (GCL) neurons 24 h after the insult. We investigated the activation of autophagy in GCL-neurons following ischemia/reperfusion, using acid phosphatase (AP) histochemistry and immunofluorescence against LC3 and LAMP1. Retinal I/R lead to the appearance of AP-positive granules and LAMP1-positive vesicles 12 and 24 h after the insult, and LC3 labelling at 24 h, and induced a consistent retinal neuron death. At 48 h the retina was negative for autophagic markers. In addition, Western Blot analysis revealed an increase of LC3 levels after damage: the increase in the conjugated, LC3-II isoform is suggestive of autophagic activity. Inhibition of autophagy by 3-methyladenine partially prevented death of neurons and reduces apoptotic markers, 24 h post-lesion. The number of neurons in the GCL decreased significantly following I/R (I/R 12.21±1.13 vs controls 19.23±1.12 cells/500 µm); this decrease was partially prevented by 3-methyladenine (17.08±1.42 cells/500 µm), which potently inhibits maturation of autophagosomes. Treatment also prevented the increase in glial fibrillary acid protein immunoreactivity elicited by I/R. Therefore, targeting autophagy could represent a novel and promising treatment for glaucoma and retinal ischemia.


Conflict of interest statement

Competing Interests: The authors have declared that no competing interests exist.

Figures

Figure 1
Figure 1. AP and endocytic activities in the retina.
A–F: acid phosphatase (AP) activity is visualized with Gomori's (A, C, E) and Barka & Anderson (B and D) staining, counterstained with methyl green. 12 h after I/R, positive cells are located only in the ganglion cell layer (GCL), and are identified by their content of typical brown cytoplasmic granules (arrowheads in A) and by the red reaction (B, arrows) in the GCL and INL. 24 h after I/R, AP-positive cells are visible in both the GCL (arrows) and INL (arrowheads) (C–D). Only weak staining in the GCL is seen with the Gomori technique 48 h after I/R (E). No labeling is found in control retinas (F). Markedly positive cytoplasmic granules are visible in GCL-cells at higher magnification (G). H–I: 24h after I/R and intravitreal injection of HRP (H) or 4.4 kDa FITC-labelled dextran (I, arrows), corresponding granules are visible in neurons. GCL  =  ganglion cell layer; IPL  =  inner plexiform layer; INL  =  inner nuclear layer; OPL  =  outer plexiform layer; ONL  =  outer nuclear layer. Scale bars  =  100 µm and 10 µm (G and H).
Figure 2
Figure 2. Immunofluorescence against LAMP1 and LC3.
All sections were counterstained with bisbenzimide (Hoechst staining) to show retinal layers. Twelve hours after I/R, LAMP1 positive cytoplasmic granules are present (A) and 24 h after I/R both LAMP1 (B) and LC3 (C) positive granules are present in the GCL (arrow) and INL (arrowheads). LC3-positive vesicles are more represented than LAMP1 vesicles. LC3-immunopositivity is absent after 48 h (D). At high magnification (E–F), clear cytoplasmic lysosomal LAMP1 positive vesicles (arrowheads) can be observed in the GCL at 24 h from the insult (E). LC3 labelling appear as numerous fluorescent dots (arrowheads) after 24 h from the I/R (F). Double immunolabeling against LAMP1 (red) and LC3 (green) at 24 h shows the relationship between autophagosomes and lysosomes (G). The increase in punctuate LC3 and LAMP1 occurs in the same neurons after 24 h (G, arrowheads). At high magnification, confocal microscopy reveals that autophagic marker and LAMP1 colocalize, suggesting that fusion of autophagosomes with lysosomes occur in dying neurons after I/R (arrowheads, H). Abbreviations as in Figure 1. Scale bars = 50 µm (A); 100 µm (B, C, D and G) and 5 µm (E, F and H).
Figure 3
Figure 3. Immunoblot analysis of LC3 I and II expression in the retina after IOP.
(A) Autoradiography of the western blot probed with anti-LC3 and anti-βIII tubulin antibodies. (B) Quantitation of the image in (A) after normalization with βIII tubulin. Level of LC3-II in retinas increase by 20% 24 hours after IOP compared with the control (n = 2, *P<0.05). LC3-I expression in the retina does not change significant after IOP (data not shown in B).
Figure 4
Figure 4. Relationship between autophagic and apoptotic neuronal death.
(A) Double immunolabeling shows that cleaved caspase-3 is detectable in both LC3-positive (arrow) and negative (arrowheads) GCL-neurons, 24 h after injury. At high magnification of a GCL-neuron (B), LC3 (green) and cleaved caspase-3 (red) are colocalized in the same cell, as visible in B’ and B” rotations along the x- and y-axes. (C) Superposition of the confocal stacks. (D) Photomicrographs showing neurons labeled with TUNEL-staining (green) and immunofluorescence against LC3 (red) in the retina 24 h after I/R. The merge image (upper panel) shows a fraction of TUNEL-positive neurons having cytoplasmatic LC3-positive vesicles (box), and other neurons positive for either marker (LC3: arrow; TUNEL: arrowheads). (E) GCL-neurons double-positive at high magnification; apoptotic- and autophagic-markers were expressed in the same neuron (E’ and E” rotations along x- and y-axes). (*) GCL-neuron LC3- but not TUNEL- positive. (F) 3-D reconstruction of a double positive neuron in E, where the LC3-positive vesicles (red) surround the TUNEL-positive nucleus (green) (Imaris® Software). Abbreviations as in Figure 1. Scale bar: 100 µm (5 µm in C, E and F).
Figure 5
Figure 5. Effects of 3-MA treatment in I/R after 24 h.
In 3-MA-treated I/R retinas treated, LC3-positivity is markedly reduced (A), whereas lysosomal activity (LAMP1) is unchanged (B) compared to I/R retinas. (C) Cleaved caspase-3-positive cells are absent in the untreated retinas (upper panel), whereas a strong increase in cleaved caspase 3-positivity in the GCL is seen at 24 h (middle panel), significantly prevented by 3-MA treatment (bottom panel). (D) TUNEL-positive neurons are found occasionally in the control retina, whereas they increase dramatically after I/R in the GCL (arrowheads) and in INL (arrow). This increase in TUNEL-positive cells is prevented by 3-MA treatment (bottom panel). (E) I/R increase GFAP immunoreactivity (red) in the retina: in the untreated retina, only the end feet of the Müller cells (arrowheads) are GFAP-positive. GFAP expression strongly increase 24 h after I/R, and is prevented by 3-MA administration. In the I/R and I/R + 3-MA retinas, GFAP positivity is detectable in the end feet (arrowheads) and radial processes (arrows) of Müller cells. Following 3-MA treatment, the immunoreactivity is decreased versus I/R retina especially in the end feet of Müller cells. ILM: inner limiting membrane. Abbreviations as in Figure 1. (*): vitreous. Scale bar: 50 µm (100 µm in D).
Figure 6
Figure 6. Cell counts in the GCL.
Representative transverse sections through rat retina at 24 h, Hoechst staining. Retinal thickness is markedly reduced, compared to the control (A), after injury (B), mainly due to decrease in IPL thickness and number of GCL-neurons; these effects are partially prevented by 3-MA treatment (C). No statistical significant alterations are apparent in the other layers. (D) Quantification of GCL-neurons numbers in each group: in the I/R retina, the number of the GCL-neurons significantly decrease compared to controls (** P<0.01); 3-MA partially prevent neuron death (* P<0.05). Scale bar: 50 µm.

References

    1. Ames A, 3rd, Nesbett FB. Pathophysiology of ischemic cell death: III. Role of extracellular factors. Stroke. 1983;14:233–240. - PubMed
    1. Anderson DH, Guerin CJ, Erickson PA, Stern WH, Fisher SK. Morphological recovery in the reattached retina. Invest Ophthalmol Vis Sci. 1986;27:168–183. - PubMed
    1. Arnold AC. Anterior ischemic optic neuropathy. Semin Ophthalmol. 1995;10:221–233. - PubMed
    1. Kent D, Hickey-Dwyer M, Clark D. Long-term follow-up of ischaemic retinopathy in the antiphospholipid syndrome with lupus-like disease. Eye (Lond) 14 (Pt. 2000;3A):313–317. - PubMed
    1. Smith GG, Baird CD. Survival time of retinal cells when deprived of their blood supply by increased intraocular pressure. Am J Ophthalmol. 1952;35:133–136. - PubMed

Publication types

MeSH terms