

Memory T cells persisting in the brain following MCMV infection induce long-term microglial activation via interferon-γ
- PMID: 21800103
- PMCID: PMC3204167
- DOI: 10.1007/s13365-011-0042-5
Memory T cells persisting in the brain following MCMV infection induce long-term microglial activation via interferon-γ
Abstract
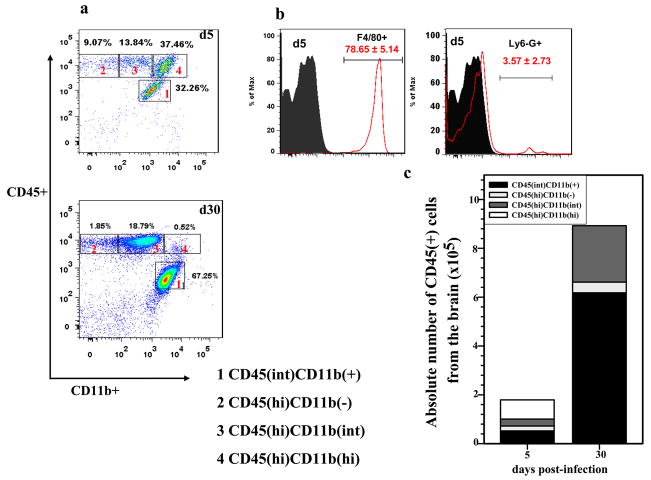
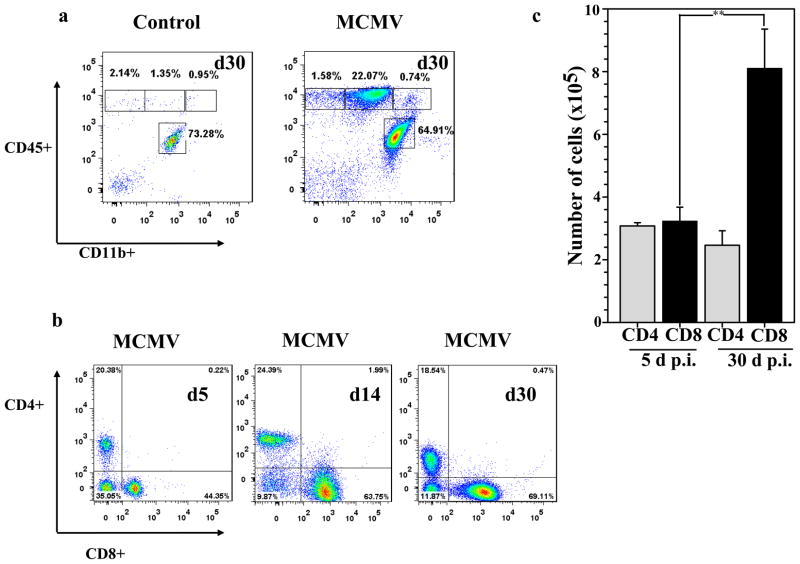
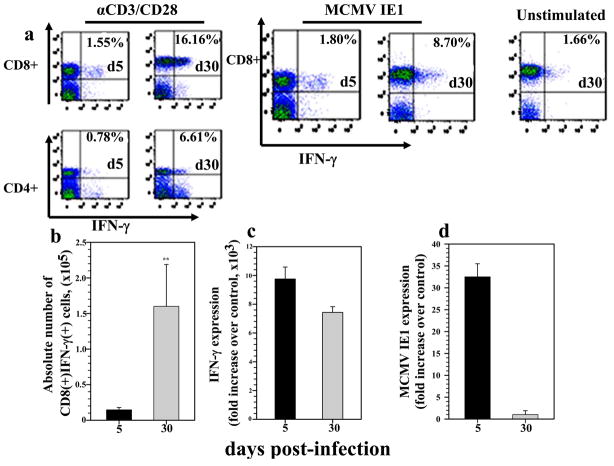
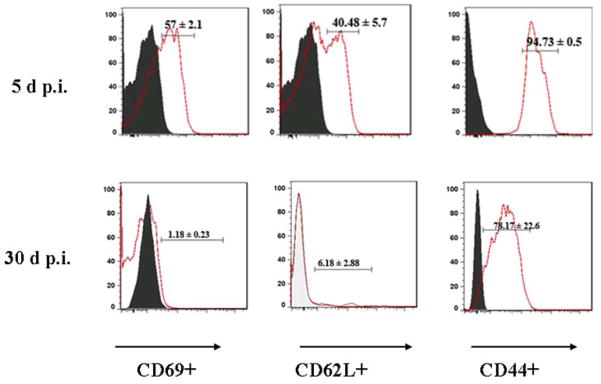
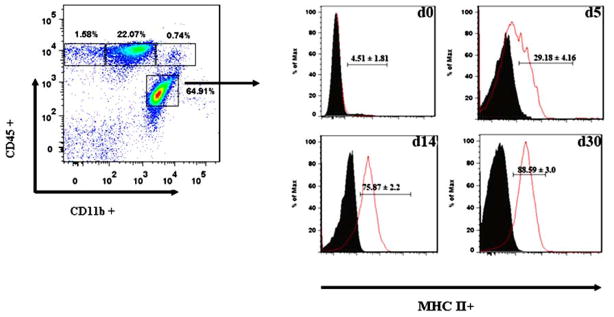
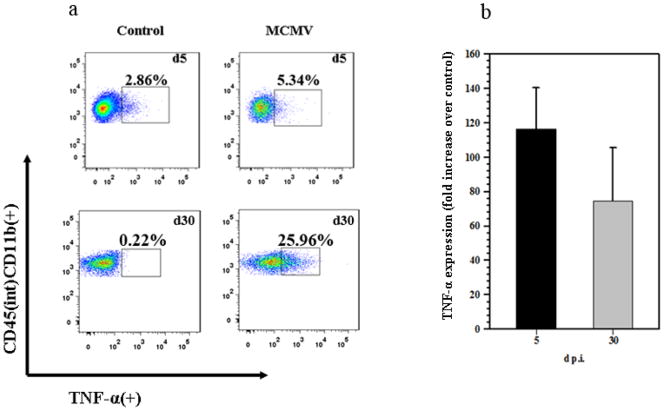
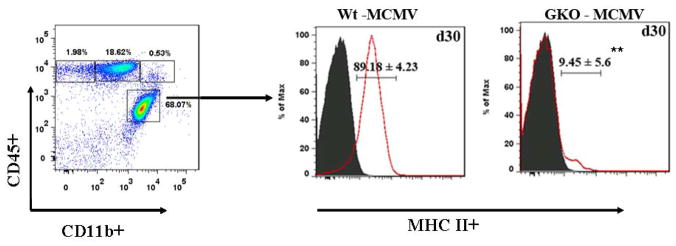
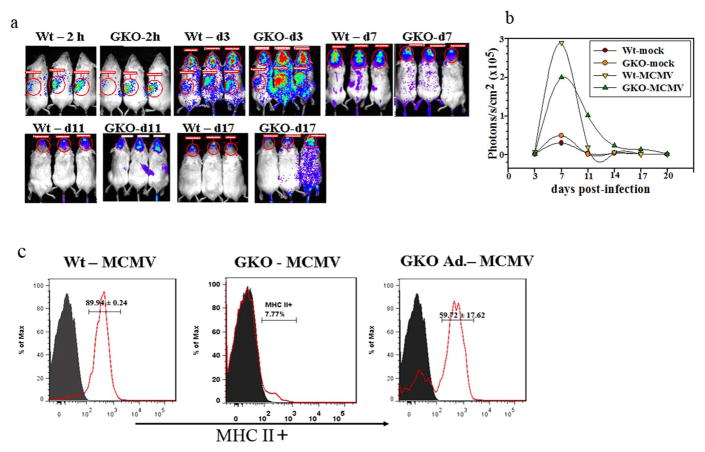
Murine cytomegalovirus (MCMV) brain infection stimulates microglial cell-driven proinflammatory chemokine production which precedes the presence of brain-infiltrating systemic immune cells. Here, we show that in response to MCMV brain infection, antigen-specific CD8(+) T cells migrated into the brain and persisted as long-lived memory cells. The role of these persistent T cells in the brain is unclear because most of our understanding of antimicrobial T cell responses comes from analyses of lymphoid tissue. Strikingly, memory T cells isolated from the brain exhibited an effector phenotype and produced IFN-γ upon restimulation with viral peptide. Furthermore, we observed time-dependent and long-term activation of resident microglia, indicated by chronic MHC class II up-regulation and TNF-α production. The immune response in this immunologically restricted site persisted in the absence of active viral replication. Lymphocyte infiltrates were detected until 30 days post-infection (p.i.), with CD8(+) and CD4(+) T cells present at a 3:1 ratio, respectively. We then investigated the role of IFN-γ in chronic microglial activation by using IFN-γ-knockout (GKO) mice. At 30 days p.i., GKO mice demonstrated a similar phenotypic brain infiltrate when compared to wild-type mice (Wt), however, MHC class II expression on microglia isolated from these GKO mice was significantly lower compared to Wt animals. When IFN-γ producing CD8(+) T cells were reconstituted in GKO mice, MHC class II up-regulation on microglial cells was restored. Taken together, these results suggest that MCMV brain infection results in long-term persistence of antigen-specific CD8(+) T cells which produce IFN-γ and drive chronic microglial cell activation. This response was found to be dependent on IFN-γ production by viral Ag-specific T cells during the chronic phase of disease.
Conflict of interest statement
Conflict of interest statement: All authors declare that there are no conflicts of interest.
Figures
Similar articles
-
Murine cytomegalovirus inhibits interferon gamma-induced antigen presentation to CD4 T cells by macrophages via regulation of expression of major histocompatibility complex class II-associated genes.J Exp Med. 1998 Apr 6;187(7):1037-46. doi: 10.1084/jem.187.7.1037. J Exp Med. 1998. PMID: 9529320 Free PMC article.
-
Perforin-mediated effector function within the central nervous system requires IFN-gamma-mediated MHC up-regulation.J Immunol. 2003 Mar 15;170(6):3204-13. doi: 10.4049/jimmunol.170.6.3204. J Immunol. 2003. PMID: 12626579
-
Prolonged microglial cell activation and lymphocyte infiltration following experimental herpes encephalitis.J Immunol. 2008 Nov 1;181(9):6417-26. doi: 10.4049/jimmunol.181.9.6417. J Immunol. 2008. PMID: 18941232 Free PMC article.
-
Brain-Resident T Cells Following Viral Infection.Viral Immunol. 2019 Jan/Feb;32(1):48-54. doi: 10.1089/vim.2018.0084. Epub 2018 Sep 18. Viral Immunol. 2019. PMID: 30230418 Free PMC article. Review.
-
The role of T-cell-mediated mechanisms in virus infections of the nervous system.Curr Top Microbiol Immunol. 2001;253:219-45. doi: 10.1007/978-3-662-10356-2_11. Curr Top Microbiol Immunol. 2001. PMID: 11417137 Review.
Cited by
-
Glial cell activation, recruitment, and survival of B-lineage cells following MCMV brain infection.J Neuroinflammation. 2016 May 20;13(1):114. doi: 10.1186/s12974-016-0582-y. J Neuroinflammation. 2016. PMID: 27207308 Free PMC article.
-
Dysregulated Microglial Cell Activation and Proliferation Following Repeated Antigen Stimulation.Front Cell Neurosci. 2021 Aug 10;15:686340. doi: 10.3389/fncel.2021.686340. eCollection 2021. Front Cell Neurosci. 2021. PMID: 34447297 Free PMC article.
-
Immune surveillance of cytomegalovirus in tissues.Cell Mol Immunol. 2024 Sep;21(9):959-981. doi: 10.1038/s41423-024-01186-2. Epub 2024 Aug 12. Cell Mol Immunol. 2024. PMID: 39134803 Free PMC article. Review.
-
Controllable and uncontrollable stress differentially impact pathogenicity and survival in a mouse model of viral encephalitis.J Neuroimmunol. 2018 Jun 15;319:130-141. doi: 10.1016/j.jneuroim.2018.02.014. Epub 2018 Mar 8. J Neuroimmunol. 2018. PMID: 29580714 Free PMC article.
-
The PD-1: PD-L1 pathway promotes development of brain-resident memory T cells following acute viral encephalitis.J Neuroinflammation. 2017 Apr 13;14(1):82. doi: 10.1186/s12974-017-0860-3. J Neuroinflammation. 2017. PMID: 28407741 Free PMC article.
References
-
- Bachmann MF, Wolint P, Schwarz K, Oxenius A. Recall proliferation potential of memory CD8+ T cells and antiviral protection. J Immunol. 2005;175:4677–85. - PubMed
-
- Badovinac VP, Corbin GA, Harty JT. Cutting edge: OFF cycling of TNF production by antigen-specific CD8+ T cells is antigen independent. J Immunol. 2000;165:5387–91. - PubMed
-
- Benveniste EN. Role of macrophages/microglia in multiple sclerosis and experimental allergic encephalomyelitis. J Mol Med. 1997;75:165–73. - PubMed
-
- Bergmann CC, Parra B, Hinton DR, Chandran R, Morrison M, Stohlman SA. Perforin-mediated effector function within the central nervous system requires IFN-gamma-mediated MHC up-regulation. J Immunol. 2003;170:3204–13. - PubMed
Publication types
MeSH terms
Substances
Grants and funding
LinkOut - more resources
Full Text Sources
Medical
Research Materials
