Comparative Study
. 2012 Feb 15;520(3):544-69.
doi: 10.1002/cne.22732.

Cortical and subcortical connections of V1 and V2 in early postnatal macaque monkeys

Affiliations
Comparative Study

Cortical and subcortical connections of V1 and V2 in early postnatal macaque monkeys

Mary K L Baldwin et al. J Comp Neurol. .

Abstract

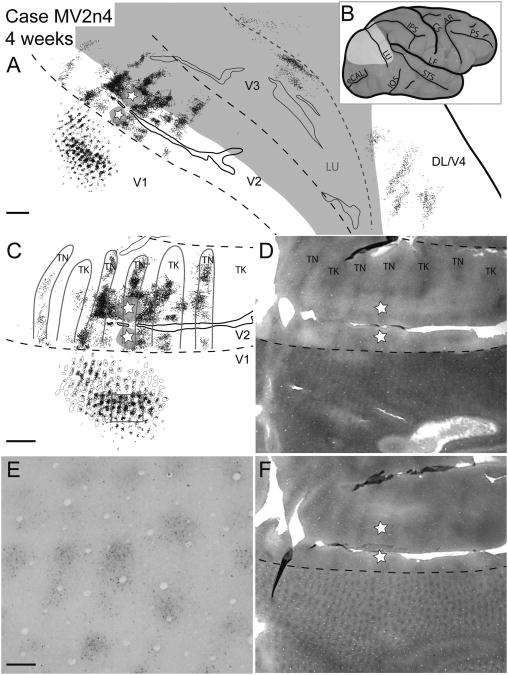
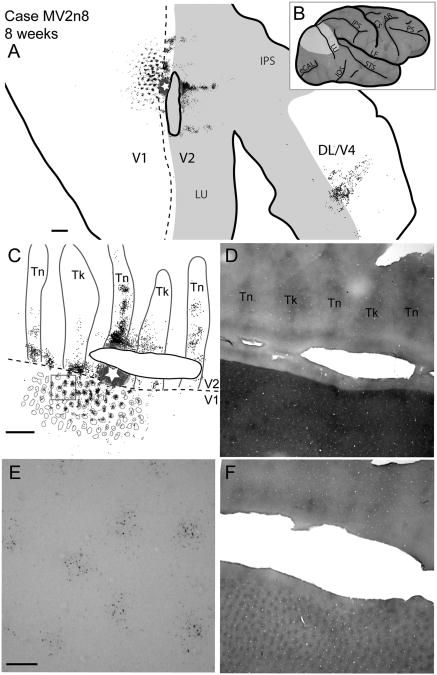
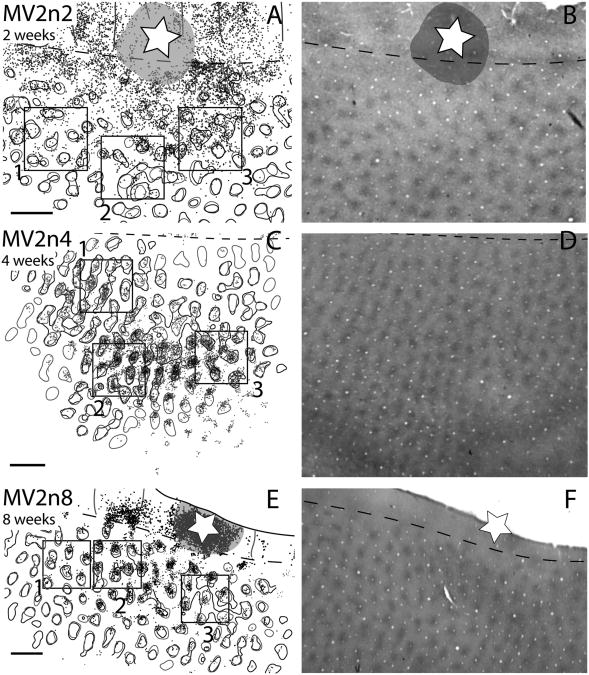
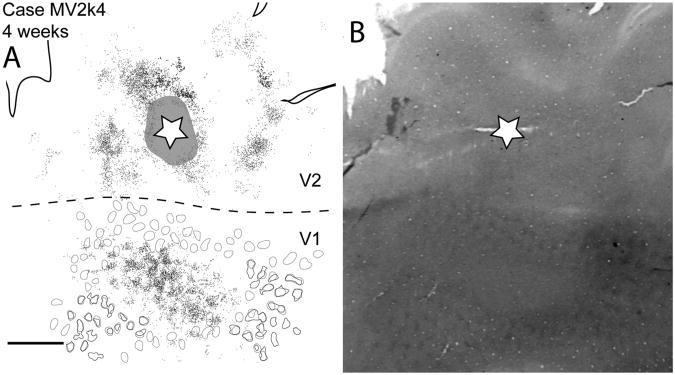
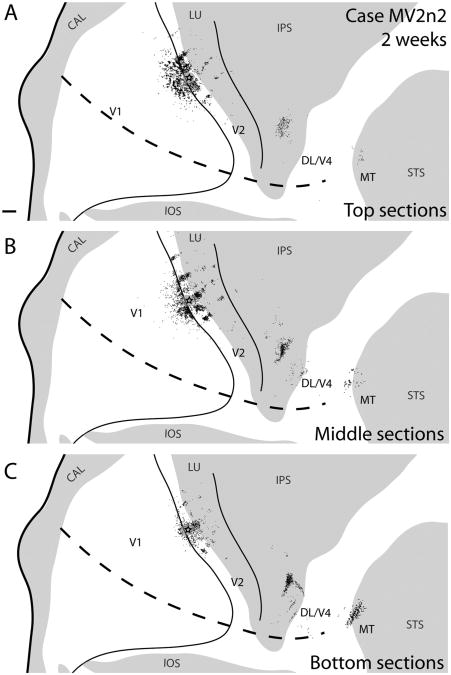
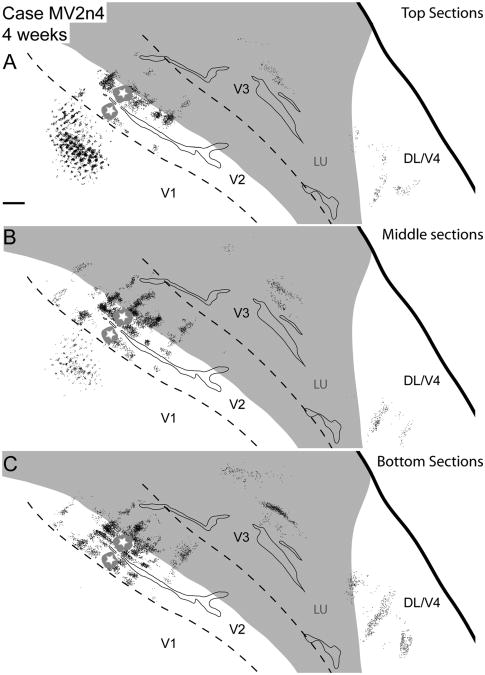
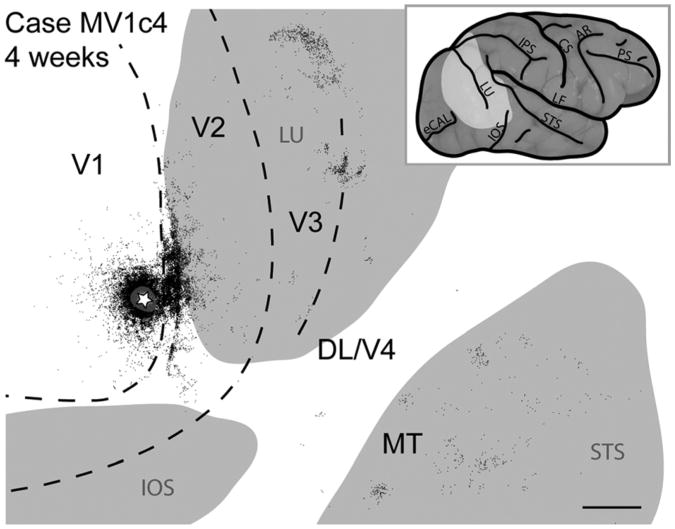
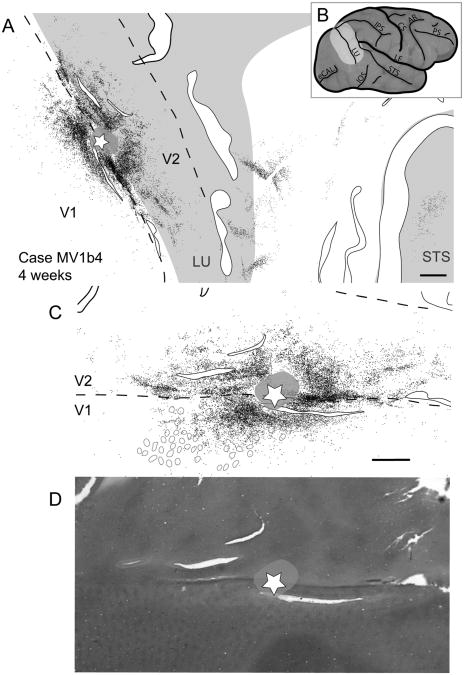
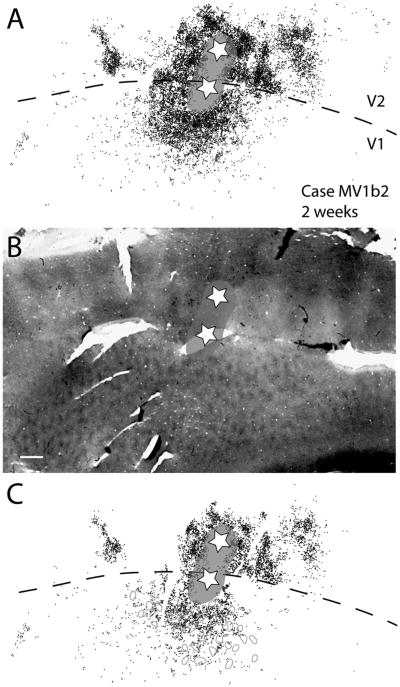
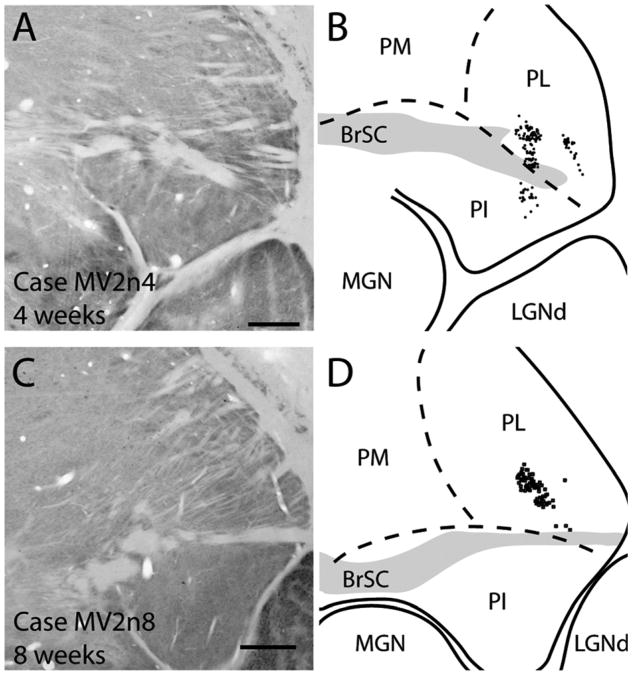
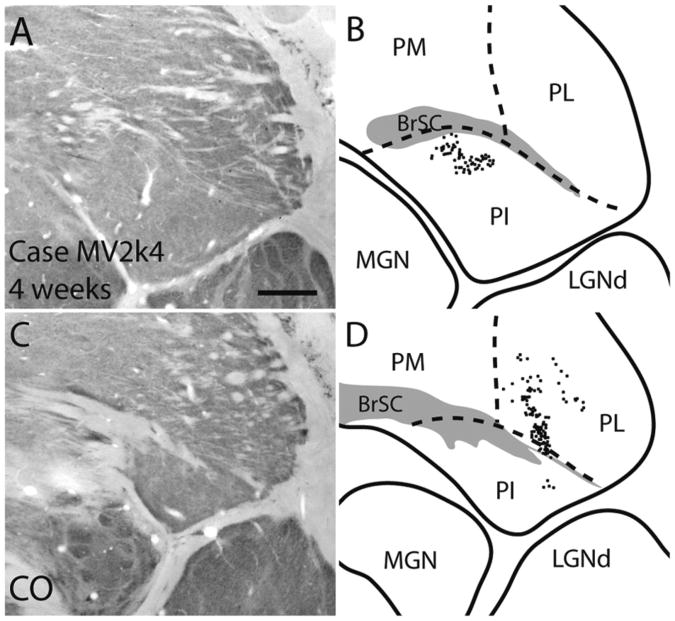
Connections of primary (V1) and secondary (V2) visual areas were revealed in macaque monkeys ranging in age from 2 to 16 weeks by injecting small amounts of cholera toxin subunit B (CTB). Cortex was flattened and cut parallel to the surface to reveal injection sites, patterns of labeled cells, and patterns of cytochrome oxidase (CO) staining. Projections from the lateral geniculate nucleus and pulvinar to V1 were present at 4 weeks of age, as were pulvinar projections to thin and thick CO stripes in V2. Injections into V1 in 4- and 8-week-old monkeys labeled neurons in V2, V3, middle temporal area (MT), and dorsolateral area (DL)/V4. Within V1 and V2, labeled neurons were densely distributed around the injection sites, but formed patches at distances away from injection sites. Injections into V2 labeled neurons in V1, V3, DL/V4, and MT of monkeys 2-, 4-, and 8-weeks of age. Injections in thin stripes of V2 preferentially labeled neurons in other V2 thin stripes and neurons in the CO blob regions of V1. A likely thick stripe injection in V2 at 4 weeks of age labeled neurons around blobs. Most labeled neurons in V1 were in superficial cortical layers after V2 injections, and in deep layers of other areas. Although these features of adult V1 and V2 connectivity were in place as early as 2 postnatal weeks, labeled cells in V1 and V2 became more restricted to preferred CO compartments after 2 weeks of age.


Figures

Figure 1
Figure 1
Filtering figure showing the two methods used for determining blob borders. A: Photomicrograph of CO blob patterns in V1 of an 8-week-old macaque monkey adjusted for contrast. Two procedures were used to determine blob borders. In the first method, images were imported into Image J, adjusted by using the auto local threshold plug-in, and smoothed. B: Then images were imported into Adobe Photoshop where the threshold levels were adjusted and images were noise filtered. D: Finally, edges were determined by using the stylize filter. In the second method, images were imported into Adobe Photoshop, where they were adjusted for contrast (A); C: after this borders were determined with visual inspection. E: A comparison of blob borders for these two methods. Scale bar = 0.5 mm in A.
Figure 2
Figure 2
Case MV2n4. Reconstruction of a V2 thin stripe injection and labeled neurons in a 2-week-old macaque. A: Reconstruction of labeled cells throughout the brain of a 2-week-old macaque after a CTB injection into a thin stripe in V2. The star and gray halo represent the injection site location and spread, respectively. In this and subsequent figures, black dots represent retrogradely labeled CTB cells. Gray shaded areas represent unfolded sulci and dashed black lines represent borders between visual areas determined with cytochrome oxidase and local cortical landmarks. B: A lateral view of the macaque brain before artificial flattening. The highlighted area corresponds to the area of the brain shown in A. C: A magnified view of CTB label along the V1/V2 border overlaid with stripe type and blob borders of cytochrome oxidase staining based on E and F. D: Cytochrome oxidase photomicrograph showing the stripe type pattern in V2. TN and TK correspond to thin and thick stripes, respectively. E: A photomicrograph of a portion of V1 (boxed area from C) of a single CTB section with retrogradely labeled cells. F: Cytochrome oxidase photomicrograph demonstrating the blob pattern in V1. For abbreviations, see list. Scale bar = 2 mm in A and C (applies to C,D,F); 0.25 mm in E. CAL is the calcarine sulcus, IPS the intraparietal sulcus, STS the superior temporal sulcus, and IOS the inferior occipital sulcus. V1 is the primary visual area, V2 is the secondary visual area, V3 is the third visual area, DL/V4 is the dorsolateral/fourth visual area. TN, TK are thin and thick stripes respectively.
Figure 3
Figure 3
Case MV2n2. Reconstruction of a V2 thin stripe injection and labeled neurons in a 2-week-old macaque. A: Reconstruction of labeled cells throughout the brain of a 2-week-old macaque after a CTB injection into a thin stripe in V2. The star and gray halo represent the injection site location and spread, respectively. Solid black lines represent borders between visual areas determined with cytochrome oxidase; dashed black line presents the estimated horizontal meridian. B: A lateral view of the macaque brain before artificial flattening. The highlighted area corresponds to the area of the brain shown in A. C: A magnified view of CTB label along the V1/V2 border overlaid with CO stripe and blob borders determined by using images D and F. D: Cytochrome oxidase photomicrograph showing the stripe type pattern in V2. E: A photomicrograph of a portion of V1 (boxed area from C) of a single CTB section with retrogradely labeled cells. F: Cytochrome oxidase photomicrograph demonstrating the blob pattern in V1. Tn, thin stripes; Tk, thick stripes. For other abbreviations, see list. Scale bar = 2 mm in A,C,D,F; 0.25 mm in E.
Figure 4
Figure 4
Case MV2n8. Reconstruction of a CTB injection into a V2 thin stripe and resultant label of an 8-week-old macaque. A: A reconstruction of all cortical sections with retrogradely labeled CTB cells. B: A lateral view of an iconic macaque brain. The light gray area represents the area shown in A. C: A magnified view of CTB label along the V1/V2 border overlaid with CO stripe and blob borders determined by using images D and F. D: A photomicrograph of a CO section used to determine the V1, V2 border, as well as the stripe types within V2. E: A photomicrograph of a portion of V1 (boxed area from C) of a single CTB section with retrogradely labeled cells. F: A photomicrograph of the CO section used to determine CO blob locations. For abbreviations, see list. Scale bar = 2 mm in A, C (applies to C,D,F); 0.25 mm in E.
Figure 5
Figure 5
V1 blob and interblob cell locations after injections in thin stripes for 2-, 4-, and 8-week-old macaques. A,C,E: Close-up views of V1 from Figures 2, 3, and 4. B,D,E: The corresponding photomicrographs of V1 blob patterns expressed with cytochrome oxidase staining for A, C, and E, respectively. Gray circles indicate the blob borders determined with visual inspection, and black circles represent blob borders determined with computer filtering. Scale bar = 1 mm in A (applies to A,B), C (applies to C,D), and E (applies to E,F).
Figure 6
Figure 6
Case MV2k4. A: Reconstruction of a V2 CTB injection and labeled neurons in a 4-week-old macaque monkey most likely in a thick CO stripe. Gray circles in V1 represent blob borders determined by visual inspection. Black circles represent blob borders determined by computer filtering by Image J and Photoshop. B: Photomicrograph of a cytochrome oxidase stained section used for determining blob, and V2/V2 border. For abbreviations, see list. Scale bar = 2 mm in A (applies to A,B).
Figure 7
Figure 7
Case MV2n2. AC: Reconstructions of a V2 thin stripe injection and labeled neurons in a 2-week-old macaque at various depths of flattened cortex. The superficial section reconstruction is composed of the two most superficial CTB sections, the intermediate sections reconstruction is composed of the three intermediate CTB sections, and the deep sections reconstruction is composed of the two deepest CTB sections in the series of all cortical sections. For abbreviations, see list. Scale bar = 2 mm in A (applies to A–C).
Figure 8
Figure 8
Case MV2n4. AC: Reconstructions of a V2 thin stripe injection and labeled neurons in a 4-week-old macaque at various depths of flattened cortex. The superficial section reconstruction is composed of the two most superficial CTB sections, the intermediate sections reconstruction is composed of the three intermediate CTB sections, and the deep sections reconstruction is composed of the two deepest CTB sections in the series of all cortical sections. For abbreviations, see list. Scale bar = 2 mm in A (applies to A–C).
Figure 9
Figure 9
MV2n8. Reconstruction of a V2 thin stripe CTB injection and labeled neurons in an 8-week-old macaque at various depth planes. A: The two most superficial sections with CTB label. B: The two intermediate sections with CTB label. C: The two deepest sections with CTB label. For abbreviations, see list. Scale bar = 2 mm in A (applies to A–C).
Figure 10
Figure 10
Case MV1c4. Reconstruction of a CTB injection into V1 and labeled neurons of a 4-week-old macaque monkey. Gray regions represent the lunate sulcus (LU), the inferior occipital sulcus (IOS), and the superior temporal sulcus (STS). For other abbreviations, see list. Scale bar = 5 mm.
Figure 11
Figure 11
Case MV2b2. A: Reconstruction of a V1/V2 border injection and labeled neurons in a 2-week-old macaque. B: Lateral view of an intact macaque brain with the highlighted region indicating the region of brain shown in A. C: Close-up view of the injection site, and labeled cells along the V1/V2 border. Gray circles represent the location of cytochrome oxidase blobs. D: Photomicrograph of a cytochrome oxidase section showing the location of blobs and interblobs. For abbreviations, see list. Scale bar = 2 mm in A; 1 mm in C (applies to C,D).
Figure 12
Figure 12
Case MV1b4. A: Reconstruction of a V1/V2 border injection and labeled neurons in a 4-week-old macaque monkey. Solid black lined white spaces represent tears in the tissue. B: Lateral view of a macaque brain with the estimated tissue shown in A outlined on the surface of the folded brain in light gray. Gray circles indicate the location of detectable blobs in the vicinity of labeled cells. C: Close-up view of labeled cells along the V1/V2 border from A. D: Cytochrome oxidase section showing the V1/V2 border as well as blob and interblob locations. For abbreviations, see list. Scale bar = 2 mm in A; 1 mm in C (applies to C,D).
Figure 13
Figure 13
Case MV1b2. A: Reconstruction of retrogradely labeled cells after two closely spaced CTB injections along the V1/V2 border in a 2-week-old macaque. The two stars represent the injection locations. One injection site is more in V1, whereas the second injection site is more in V2 (the stripe type is uncertain). The gray halo represents the tracer spread, which continues from one injection site to the other across the V1/V2 border. This reconstruction was made by merging three CTB sections together. B: Photomicrograph of a cytochrome oxidase stain with the injection site locations and tracer spread superimposed on top. C: A single middle CBT section from the three CTB sections shown in A. Close to the injection site in V1, the label is quite dense; however, further away from the injection site the label is somewhat patchy. For abbreviations, see list. Scale bar = 1 mm in B (applies to A–C).
Figure 14
Figure 14
Thalamocortical connections of a CTB injection into V1 of a 4-week-old macaque monkey. A,C: Photomicrographs of coronally cut cytochrome oxidase sections used to determine the location of CTB-labeled cells (black dots). B,D: Location of CTB-labeled cells within the dorsal lateral geniculate nucleus (LGNd: top) and pulvinar complex (bottom). The magnocellular layers of the LGNd are outlined using thin gray lines within the drawing of the LGN in the top right panel. Solid black lines represent borders between nuclei of the thalamus, and dashed lines represent borders between the medial, lateral, and inferior pulvinar. For abbreviations, see list. Scale bar = 1 mm in A (applies to A–D).
Figure 15
Figure 15
Thalamocortical connections of V2 thin stripe injections in 4- (A,B) and 8-week-old (C,D) macaque monkeys. A,C: Photomicrographs of coronally cut cytochrome oxidase section used to determine borders within the thalamus. B,D: Locations of CTB labeled cells within the pulvinar complex. For abbreviations, see list. Scale bar = 1 mm in A (applies to A,B) and C (applies to C,D).
Figure 16
Figure 16
Thalamocortical connections of a V2 thick stripe injection in a 4-week-old macaque monkey. A,B: Photomicrographs of coronal cytochrome oxidase sections used to determine the location of retrogradely labeled CTB cells within the pulvinar complex. C,D: Reconstructions of labeled cells within the pulvinar complex at two different locations. D is in a more rostral section than B. For abbreviations, see list. Scale bar = 1 mm in A (applies to A–D).

References

    1. Adams MM, Hof PR, Gattass R, Webster MJ, Ungerleider LG. Visual cortical projections and chemoarchitecture of macaque monkey pulvinar. J Comp Neurol. 2000;419:377–393. - PubMed
    1. Amir Y, Harel M, Malach R. Cortical hierarchy reflected in the organization of intrinsic connections in macaque monkey visual cortex. J Comp Neurol. 1993;334:19–46. - PubMed
    1. Angelucci A, Bressloff PC. Contribution of feedforward, lateral and feedback connections to the classical receptive field center and extra-classical receptive field surround of primate V1 neurons. Prog Brain Res. 2006;154:93–120. - PubMed
    1. Angelucci, A, Bullier J. Reaching beyond the classical receptive field of V1 neurons: horizontal or feedback axons? J Physiol Paris. 2003;97:141–54. - PubMed
    1. Atkinson J, Anker S, Evans C, Hall R, Pimm-Smith E. Visual acuity testing of young children with the Cambridge Crowding Cards at 3 and 6 m. Acta Ophthalmol (Copenh) 1988;66:505–508. - PubMed

Publication types