. 2011 Dec 15;519(18):3802-14.
doi: 10.1002/cne.22734.

Quantitative analysis of glutamatergic innervation of the mouse dorsal raphe nucleus using array tomography

Affiliations

Quantitative analysis of glutamatergic innervation of the mouse dorsal raphe nucleus using array tomography

Mariano Soiza-Reilly et al. J Comp Neurol. .

Abstract

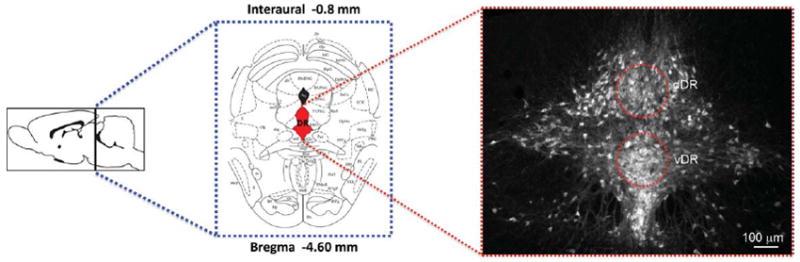
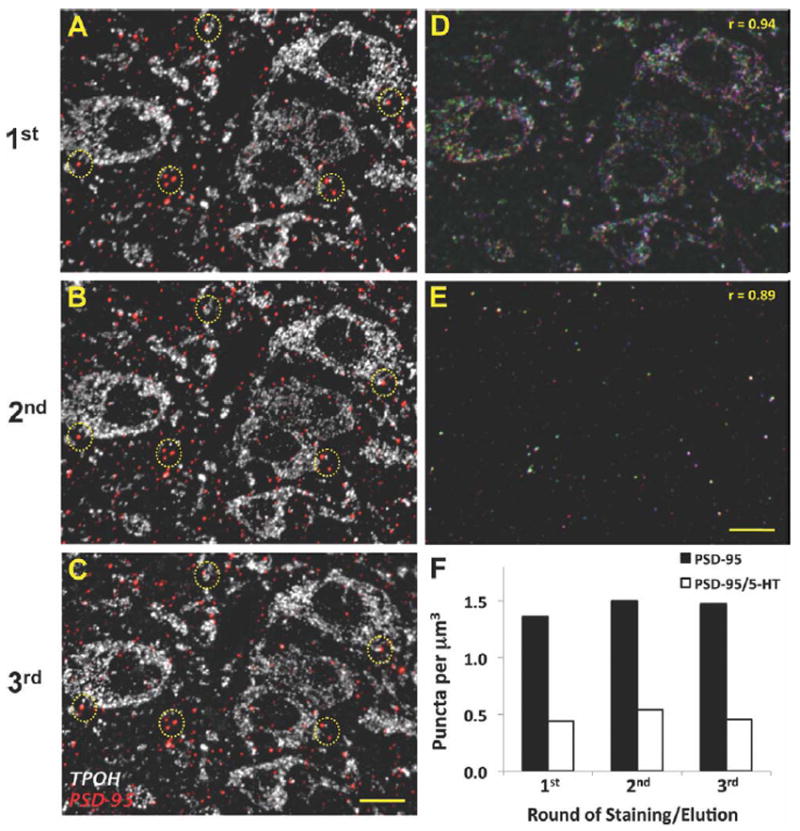
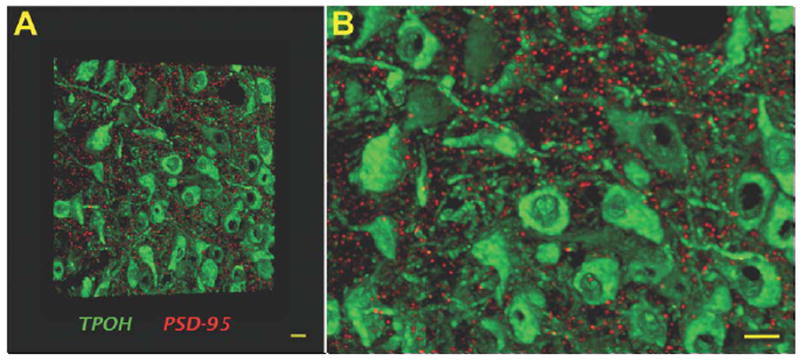
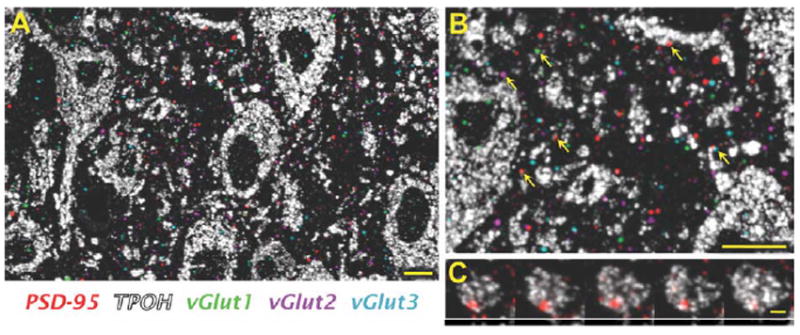
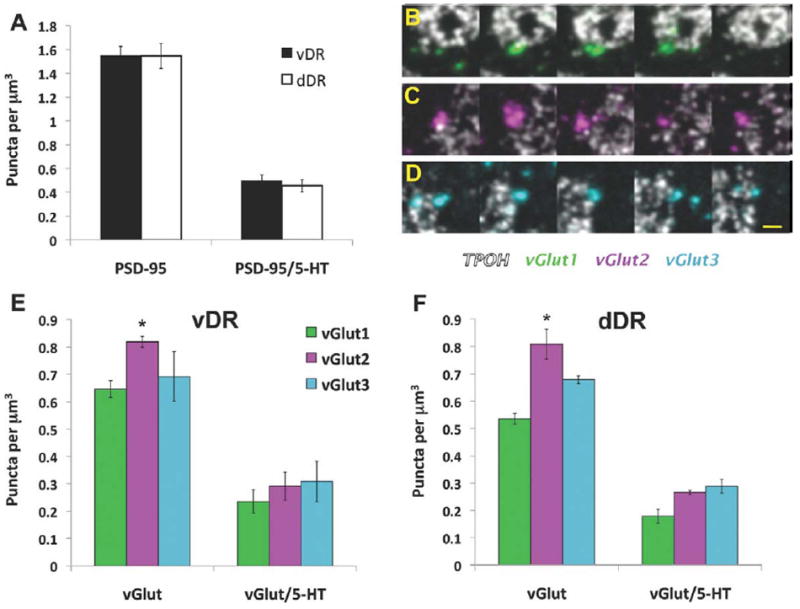
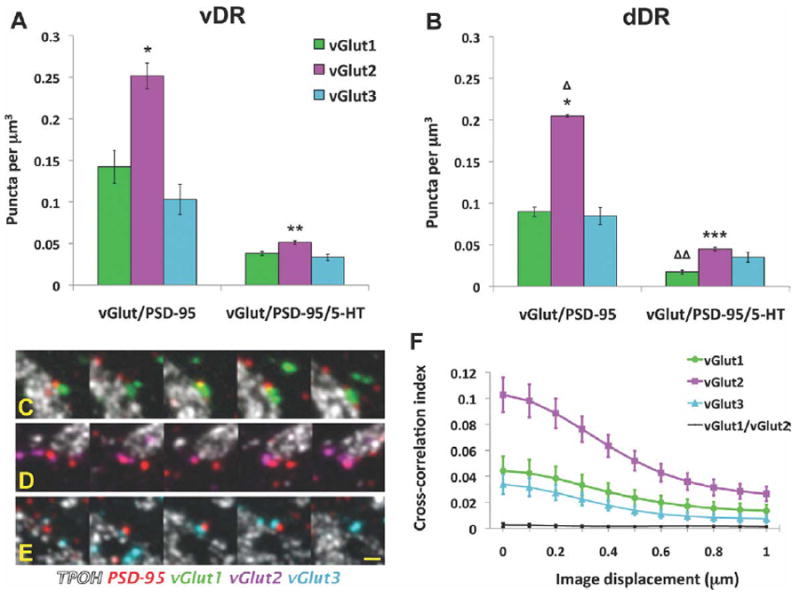
Serotonin (5-hydroxytryptamine, 5-HT) containing neurons located in the dorsal raphe nucleus (DR) comprise the main source of forebrain 5-HT and regulate emotional states in normal and pathological conditions including affective disorders. However, there are many features of the local circuit architecture within the DR that remain poorly understood. DR neurons receive glutamatergic innervation from different brain areas that selectively express three different types of the vesicular glutamate transporter (VGLUT). In this study we used a new high-resolution imaging technique, array tomography, to quantitatively analyze the glutamatergic innervation of the mouse DR. In the same volumetric images, we studied the distribution of five antigens: VGLUT1, VGLUT2, VGLUT3, the postsynaptic protein PSD-95, and a marker for 5-HT cells, the enzyme tryptophan hydroxylase (TPOH). We found that all three populations of glutamatergic boutons are present in the DR; however, the density of paired association between VGLUT2 boutons and PSD-95 was ≈2-fold higher than that of either VGLUT1- or VGLUT3-PSD-95 pairs. In addition, VGLUT2-PSD-95 pairs were more commonly found associated with 5-HT cells than the other VGLUT types. These data support a prominent contribution of glutamate axons expressing VGLUT2 to the excitatory drive of DR neurons. The current study also emphasizes the use of array tomography as a quantitative approach to understand the fine molecular architecture of microcircuits in a well-preserved neuroanatomical context.


Figures

Figure 1
Figure 1
Sampling subregions in the mouse DR. Schematic representations of the brain level and coronal section containing the area of interest, the mid-DR, adapted from the mouse brain atlas (Paxinos and Franklin, 2001) (left). Photomicrographs illustrating the distribution of serotonergic neurons, identified by TPOH immunolabeling at the mid-DR divided into dorsal (d) and ventral (v) midline subregions (right). Red areas represent areas of the DR that were sampled for analysis using array tomography. [Color figure can be viewed in the online issue, which is available at wileyonlinelibrary.com.]
Figure 2
Figure 2
Preservation of antigenicity for PSD-95 and TPOH after multiple rounds of antibodies staining/elution in array tomography. A–C: The same 70-nm ultrathin section labeled against PSD-95 (red) and TPOH (white) in three consecutive rounds of staining/elution showing highly similar patterns of labeling. Examples of the PSD-95 immunolabeling repeated in each round are shown within yellow circles. Controls where primary antisera were omitted confirmed immunolabeling was completely removed by elution procedure. D,E: Merged images from the same 70-nm section labeled for TPOH (upper panel) and PSD-95 (lower panel) in three consecutive rounds of staining/elution. The first round of staining is pseudocolored in blue, the second in red, and the third one in green. Overlapping pixels are shown in white. F: Quantitative analysis of PSD-95 puncta density either associated or not with TPOH-positive areas for the same stack of images after three rounds of antibodies staining/elution. Scale bars = 10 μm. [Color figure can be viewed in the online issue, which is available at wileyonlinelibrary.com.]
Figure 3
Figure 3
Volumetric image of labeling for TPOH and PSD-95 in the mouse DR, illustrating the high-resolution achieved in array tomography. A: A volume rendering of 30 ultrathin (70 nm) serial sections showing a high density of TPOH-positive cells (green) abundantly surrounded by discrete PSD-95 puncta (red). B: Zoomed-in view of (A) indicating the absence of out of focus light resulting in high-resolution images amenable to quantitative analysis. Scale bars = 10 μm. [Color figure can be viewed in the online issue, which is available at wileyonlinelibrary.com.]
Figure 4
Figure 4
All three types of VGLUT and PSD-95 are widely distributed in the mouse DR. A: An image of a single 70-nm section showing a high density of TPOH-positive cells (white) within the DR, densely surrounded by PSD-95 (red), VGLUT1 (green), VGLUT2 (magenta), and VGLUT3 (light blue). Notice that because this is a single 70-nm section image several VGLUT puncta that apparently lack a PSD-95 postsynaptic partner may have it in an adjacent section. B: Zoomed-in view of (A), indicating possible associations of all three types of VGLUT and PSD-95 with TPOH-positive cells (arrows). C: Serial section images through an individual PSD-95 punctum associated with a 5-HT cell. Scale bars = 10 μm in A,B; 2 μm in C. [Color figure can be viewed in the online issue, which is available at wileyonlinelibrary.com.]
Figure 5
Figure 5
Quantitative analysis of PSD-95 and VGLUT puncta in the mouse DR. A: Density of PSD-95 puncta, and their association with 5-HT cells in the ventral (vDR) and dorsal (dDR) parts of the DR. B–D: Serial section images through individual VGLUT1 (green), VGLUT2 (magenta), and VGLUT3 (light blue) puncta, respectively, in association with 5-HT cells (white). E,F: Density of VGLUT puncta and their associations with 5-HT cells in the vDR and dDR, respectively. *P < 0.002 vs. VGLUT1. Scale bar = 2 μm in D (applies to B,C). [Color figure can be viewed in the online issue, which is available at wileyonlinelibrary.com.]
Figure 6
Figure 6
Quantitative analysis of VGLUT/PSD-95 puncta appositions in the mouse DR. A,B: Density of VGLUT/PSD-95 puncta appositions, and their association with 5-HT cells in the ventral (vDR) and dorsal (dDR) parts of the DR, respectively. C–E: Serial section images of appositions containing VGLUT1 (green), VGLUT2 (magenta), or VGLUT3 (light blue), respectively, in association with 5-HT cells (white). F: Cross-correlation analysis of pixels for PSD-95 and VGLUT1 (green), VGLUT2 (magenta), or VGLUT3 (light blue) puncta in the DR. The control analysis of the poorly colocalized VGLUT1 and VGLUT2 puncta is also shown (black). *P < 10−4 vs. either VGLUT1 or VGLUT3. **P < 0.02 vs. VGLUT3. ΔP < 0.004 for dDR VGLUT/PSD-95 vs. vDR. ***P < 0.05 vs. either VGLUT1 or VGLUT3. ΔΔP < 0.003 for dDR VGLUT1/PSD-95/5-HT vs. vDR. Scale bar = 2 μm in E (applies to C,D). [Color figure can be viewed in the online issue, which is available at wileyonlinelibrary.com.]

Similar articles

Cited by

References

    1. Abbas AI, Yadav PN, Yao WD, Arbuckle MI, Grant SG, Caron MG, Roth BL. PSD-95 is essential for hallucinogen and atypical antipsychotic drug actions at serotonin receptors. J Neurosci. 2009;29:7124–7136. - PMC - PubMed
    1. Arango V, Underwood MD, Mann JJ. Serotonin brain circuits involved in major depression and suicide. Prog Brain Res. 2002;136:443–453. - PubMed
    1. Bellocchio EE, Reimer RJ, Fremeau RT, Jr, Edwards RH. Uptake of glutamate into synaptic vesicles by an inorganic phosphate transporter. Science. 2000;289:957–960. - PubMed
    1. Bolte S, Cordelières FP. A guided tour into subcellular colocalization analysis in light microscopy. J Microsc. 2006;224:213–232. - PubMed
    1. Celada P, Puig MV, Casanovas JM, Guillazo G, Artigas F. Control of dorsal raphe serotonergic neurons by the medial prefrontal cortex: involvement of serotonin-1A, GABA(A), and glutamate receptors. J Neurosci. 2001;21:9917–9929. - PMC - PubMed

Publication types

MeSH terms

Substances